


Free PERT Chart Template
Visualize project tasks. Estimate timelines. Improve accuracy.
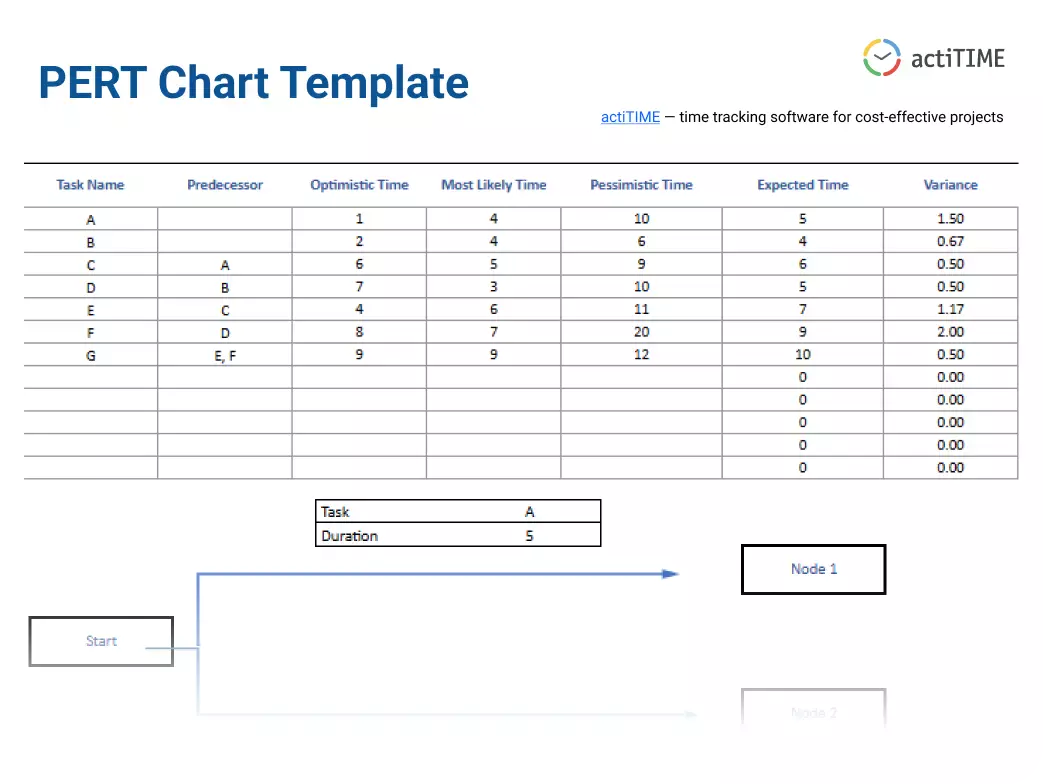
Map out project activities and use optimistic, pessimistic, and most likely estimates to forecast realistic completion times.
Visualize project tasks. Estimate timelines. Improve accuracy.
Map out project activities and use optimistic, pessimistic, and most likely estimates to forecast realistic completion times.


PERT helps teams plan and execute complex projects by factoring in uncertainty and task dependencies.
 Project Managers
 PMO Teams
 Engineers
 Construction Managers
 R&D Teams
 Business Analysts
A PERT chart is a visual planning tool that maps out the timeline and dependencies of tasks in a project while considering time uncertainty. It’s often used for complex or research-driven projects.
While CPM (Critical Path Method) uses fixed task durations, PERT estimates three time frames for each task (optimistic, pessimistic, most likely) and calculates a weighted average for better forecasting.
The template is available in Google Sheet (.xlsx) format, fully customizable with formulas included to calculate estimated durations.
Yes, it’s completely free to download and use.
Typically used by Project Managers, Engineers, or R&D Teams in collaboration with stakeholders or technical experts.

Your privacy is important to us
This website uses cookies, pixel tags, and local storage for performance, personalization, and marketing purposes. We use our own cookies and some from third parties. By clicking ‘Accept,’ you agree to the use of all cookies. You can always change your cookie settings by clicking on "Manage settings.” To learn more about our use of cookies, please see our Cookie PolicyPrivacy Preference Centre
When you visit any website, it may store or retrieve information on your browser, mostly in the form of cookies. This information might be about your preferences or your device and is mostly used to make the site work as you expect it to. The information does not usually directly identify you, but it can give you a more personalized web experience. Because we respect your right to privacy, you can choose not to allow some types of cookies. Click on the different category headings to find out more and change our default settings.
Manage Consent Preferences
These cookies are strictly necessary to provide you with certain features. For example, these cookies allow you to access secure areas that require registration and set your privacy preferences. Because these cookies are essential to providing services to you, they cannot be disabled. You can set your browser to block or alert you about these cookies, but it may cause some parts of the site to not work.
These cookies allow us to count visits and traffic sources so we can measure and improve the performance of our site. They help us to know which pages are the most and least popular and see how visitors move around the site. All information these cookies collect is aggregated and therefore anonymous. If you do not allow these cookies we will not know when you have visited our site, and will not be able to monitor its performance.
These cookies provide enhanced functionality, providing chat support, allowing you to more easily complete forms, personalizing content to your preferences, and selecting your communications preferences. If you do not enable these cookies, or choose to disable them in the future, that could impact your ability to use certain features.
These cookies assist us in providing advertising relevant to your interests on platforms such as Facebook, Google, and Twitter.