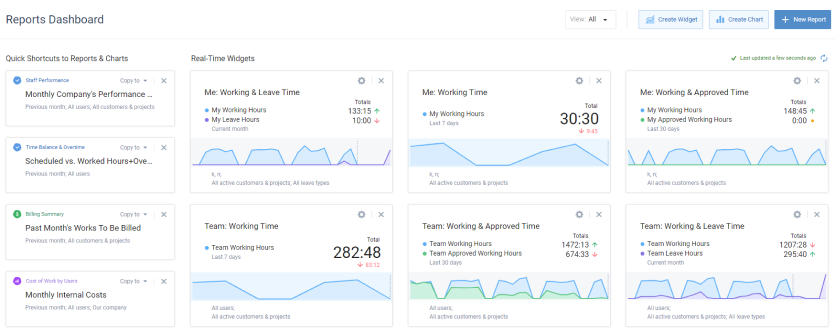
Reports Dashboard
The Reports Dashboard in actiTIME includes two core features:
- Real-Time Widgets that show how your working hours and leave time data is changing on beautiful sparkline charts
- Quick Shortcuts to Reports & Charts that let you save preferable data configuration for different reports and generate them with a single click
Besides, using this dashboard, you can create multiple time tracking reports for billing, cost management and performance analysis. The full range of your reporting options is available for review on the side panel that appears after clicking on the + New Report button.
All these reports have a flexible configuration. Depending on the type of report selected, they allow you to group data by projects, customers, dates, users or types of work.
The generated reports can be viewed in the HTML format directly in your browser or exported as CSV files for further data processing. You can also download invoices, charts, overtime / leave time reports and Estimated vs. Actual Time report in PDF.
 Reporting Dashboard
Click on the View button to choose which features you want to see on your Reports Dashboard: All, Shortcuts or Widgets. For instance, after selecting the Shortcuts filter, the saved templates will take on the full-screen mode, while the widgets will be concealed. If you select All, both your shortcuts and widgets will be displayed.
To change the position of specific widgets and shortcuts on the page, you can also make use of the simple drag-and-drop editor.
 Drag-and-drop editor
Permissions Required to Run a Report
In actiTIME, two groups of reports are available: Time and Cost & Billing reports. Access to each of these groups is regulated by separate permissions.
Time Reports: Personal
Any user with the Enter Time-Track permission can run the following time reports with their own data and summarized data of other users:
- Staff Performance
- Estimated vs. Actual Time
Any user with the Enter Time-Track permission can run the following time reports with their own data only:
- Time-Track
- Time-Track in Detail
- Time Balance & Overtime
- Leave Time & Balances
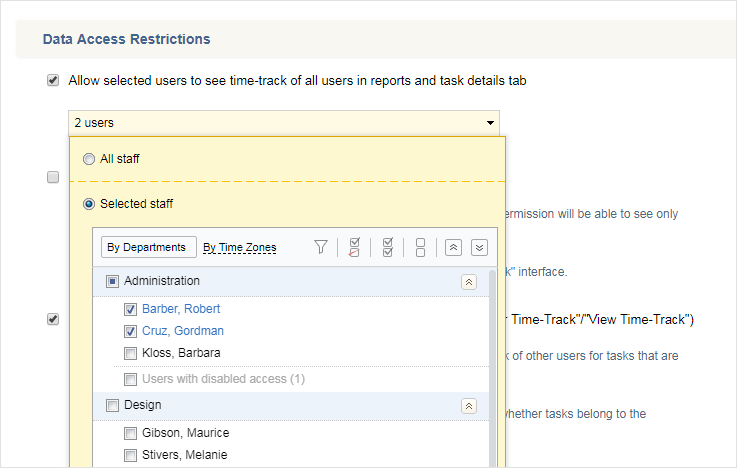
An additional setting allows you to limit or expand the data that users can access on their reports. This setting is available in Settings → General Settings → Data Access Restrictions:
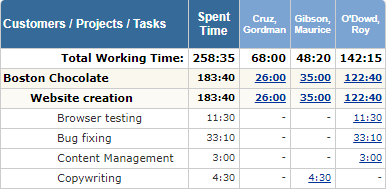
If this setting is enabled, selected users can run time reports with detailed data of all users in the system.
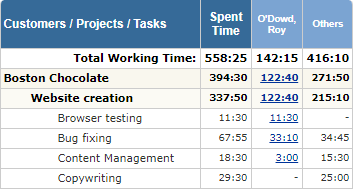
If a user is not selected in this setting or the setting is disabled, the user can only see other users’ totals under the “Others” column.
Time Reports: By Teams
Users with advanced permissions get the ability to run time reports which show detailed data for their assigned teams. This ability is shared between 5 permissions:
- Manage User Accounts & Permissions
- Modify & Approve Time-Track of Other Users
- Manage Scope of Work
- Manage PTO & Sick Days Balances
- Manage Cost & Billing Data (same time reports as for Manage Scope of Work permission)
Each of the permissions gives access to a different portion of time reports, as described in the table below:
can see details for all users
can see details for assigned team and scope
To allow managers to see details on unassigned users’ in cost & billing reports, tick the checkbox in the General Settings > Data Access Restrictions section:
See more information on specific time reports:
Cost & Billing Reports
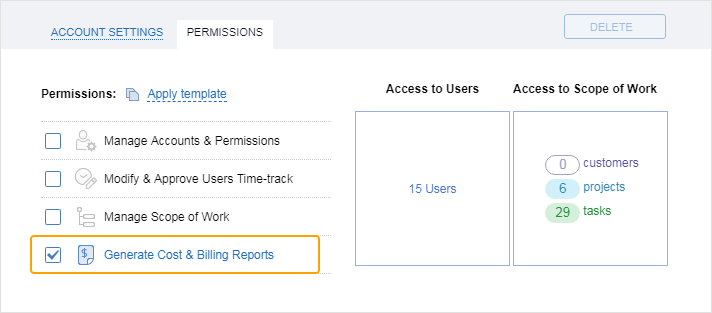
The ability to run this type of reports requires special “Manage Cost & Billing Data” permission. It can be granted in the Permissions tab of a user’s profile in Users tab.
Users with this permission will see detailed information only for their assigned team and work scope.
See more information on specific cost & billing reports:
What if I don’t see all customers, projects or tasks in my report?
What you see in the reports is a particular set of customers, projects and tasks as defined in your user permissions.
If you need to see more items in the reports, please contact your manager to provide you with wider access rights.
Time Reports
Time Reports are aimed at providing you with as much time information on every customer, project, task and team member as possible. All reports are highly customizable, so finding your perfect layout is just a matter of minutes.
Regular users can only see their personal hours, while project managers and administrators will be able to view all information related to their assigned projects and users.
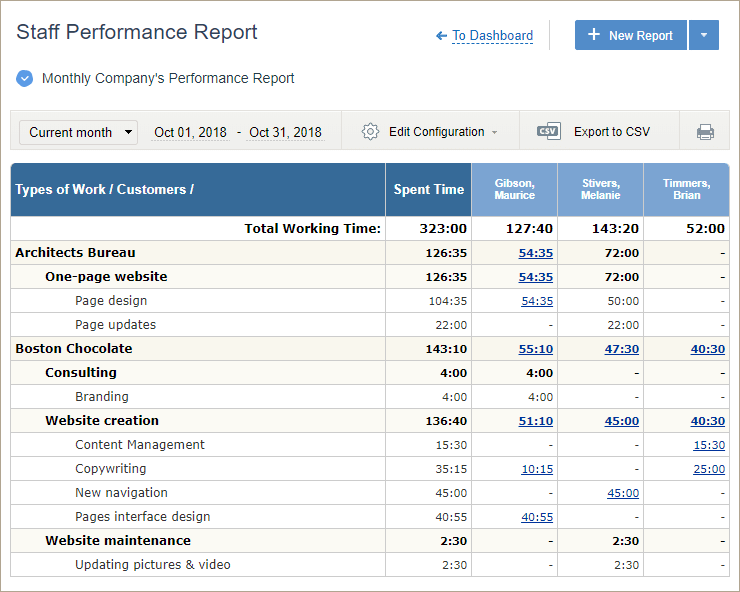
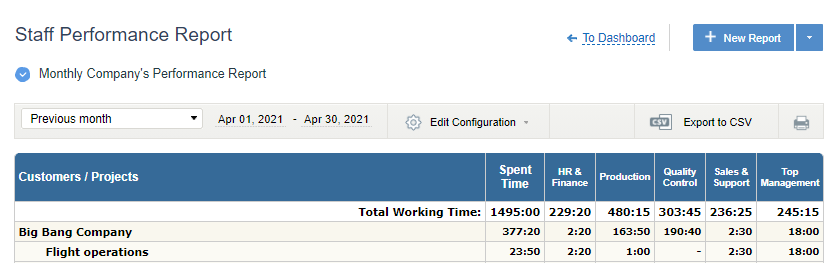
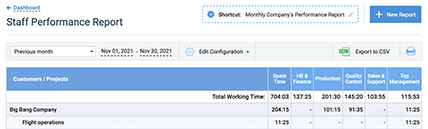
Staff Performance report provides you with information on who has reported time, on which tasks, and how much. It helps you monitor time expenses in everyday work.
Data available in the report depends on user permissions and assigned scope. Managers can run this report on their assigned team, while regular users see their own hours. For more details, please see Permissions Required to Run a Report section.
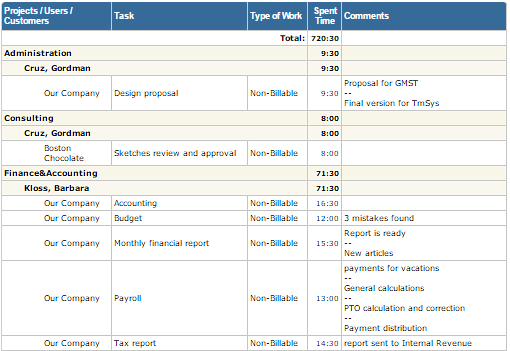
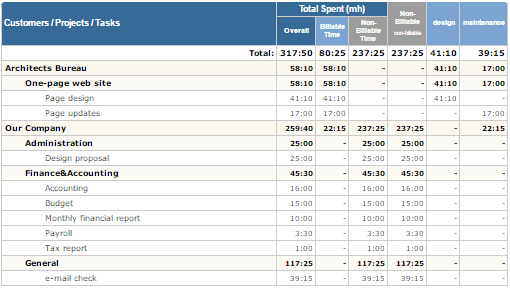
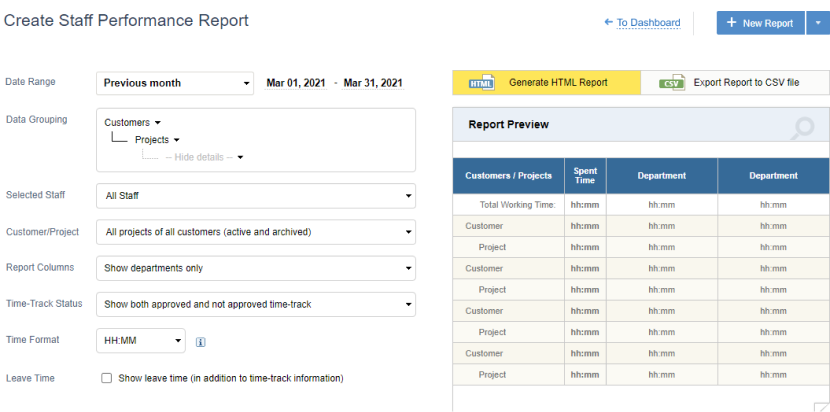
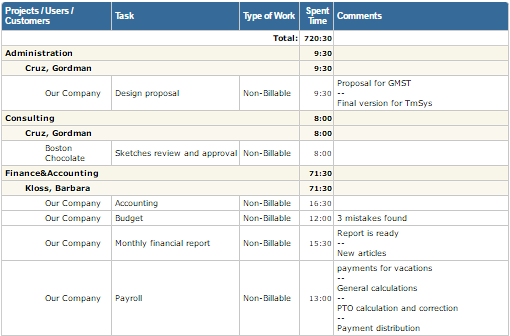
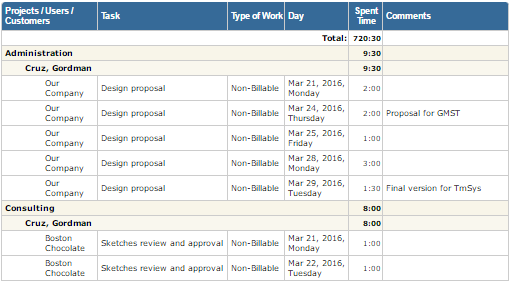
 Example of Staff Performance report, detailed form
Information presented in the report includes:
- Summary of users’ leave time data
When ‘Leave Time Tracking‘ feature is turned OFF, information on leave time is hidden in the report (see section Turn Features On / Off).
- Data on users’ approved and non-approved time-track
When ‘Time-Track Approval’ feature is turned OFF, information on approved time is hidden in the report (see section Turn Features On / Off).
- Information on hours worked. The configuration panel allows you to quickly configure the way data is shown in report rows and columns
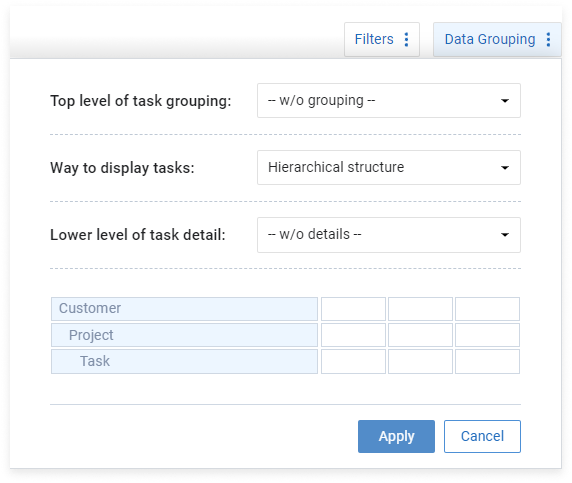
- Grouping data in report rows
You can set one or two levels of data grouping and group data by customers, projects, tasks, days etc.
Grouping by projects and tasks joined by name is a useful option, if you need to generate reports on ‘generic’ projects or tasks, i.e. projects with the same names associated with different customers and tasks with the same names performed in different projects.
actiTIME automatically calculates subtotals when grouping report data.
- Choosing data to display in report columns
You can choose to show users in alphabetical order or to group data by departments and time zone groups.
If there are users’ comments for the time-track included into the report results, their reported hours will be clickable. Clicking on a number opens a pop-up window with user’s comments:
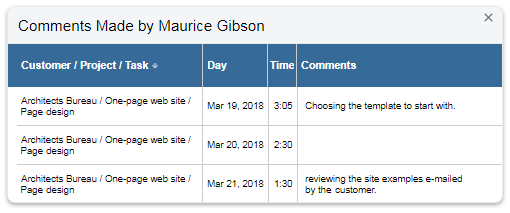 Pop-up window with comments
You may generate the Staff Performance report in a detailed or a shortened form. You can set the preferable configuration option in the Data Grouping section:
- Choose if you want to include the second grouping level (e.g., Customers, Projects, Types of Work, etc.) in your report,
- And indicate if the data should be categorized by Tasks via the Hide details drop-down menu.
 Staff Performance report, detailed form
Select ‘Hide details’ to show only summary data:
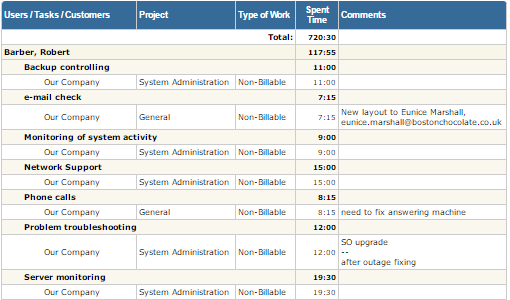
 Staff Performance report, summary form
The following filters are available for the Staff Performance report:
- System users – you can create a report for all staff from your team or for the selected system users & user groups only.
- Date range.
- Customers and projects – you can create a report for
- all projects of all customers
- all active projects of all active customers
- one or several selected customers and/or projects
Note that users can see information only for customers, projects, and tasks assigned to them.
Staff Performance Report Parameters
Parameters of Staff Performance Report include:
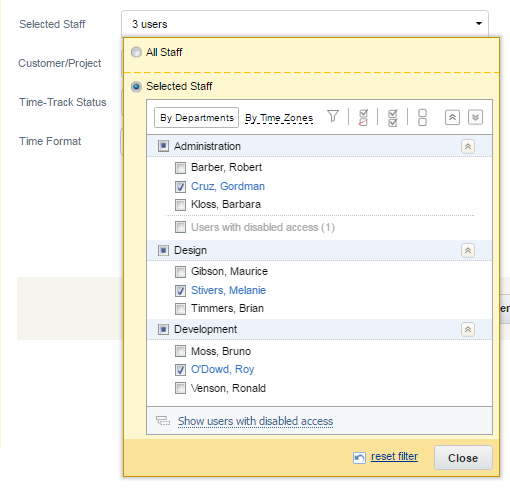
- Users to generate report for – all or selected actiTIME users, departments and time zone groups for managers, or an option to show other users’ data for regular users.
- If you select option ‘All Staff‘, the report will contain information on all users who entered time within the specified date range.
Note that users who did not enter time within the date range will not be shown in the report.
- If you select specific departments or time zone groups, report will contain information on all users from these departments or time zone groups who entered time within the specified date range.
Note that users who did not enter time within the date range will not be shown in the report.
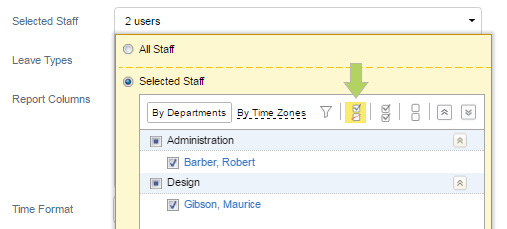
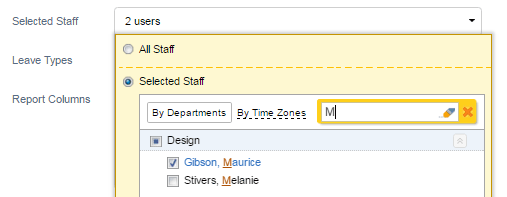
- If you select specific users, all selected users will be shown in the report even if some of them did not enter time within the selected date.
Combined with grouping report records by days, this option is useful for analysis who did not enter time-track on the specific dates.
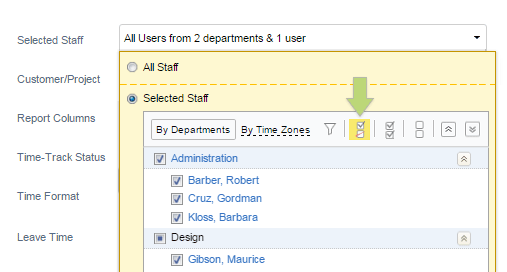
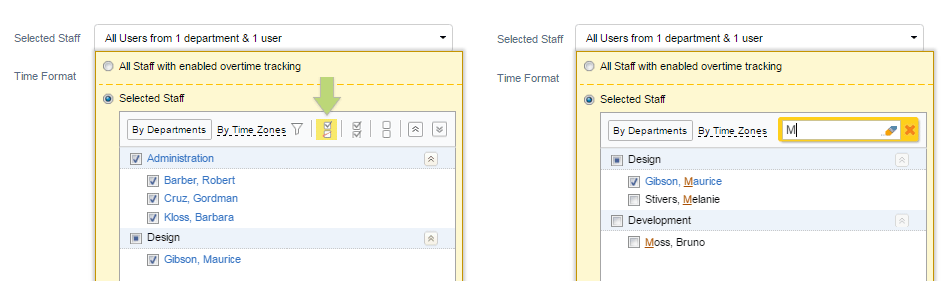
To view only selected users in the user selector click on icon.
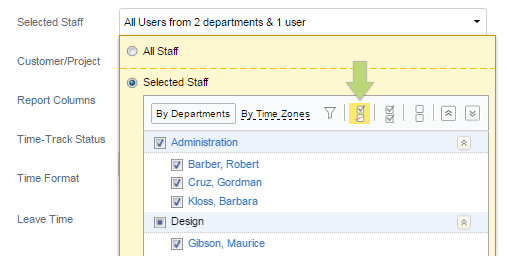 View selected user only in the user selector
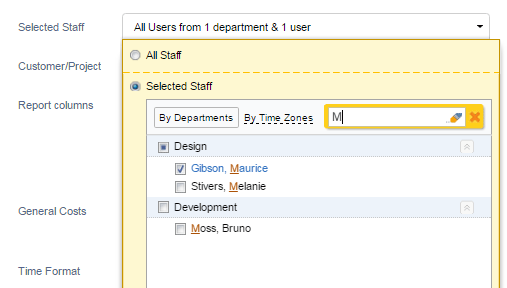
To search users by name click on icon and start typing user name.
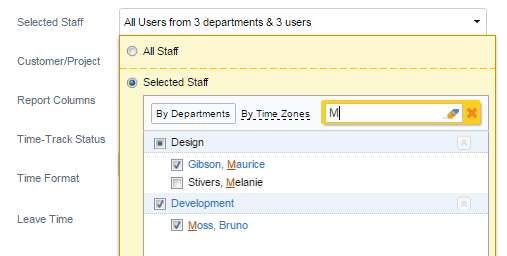 Searching users by name in the user selector
To show users with disabled access in the ‘Selected Staff‘ list select ‘Show users with disabled access‘ checkbox under the list.
- Data grouping options
- Whether to show leave time information in the report
When ‘Leave Time Tracking‘ feature is turned OFF, information on leave time is hidden in the report (see section Turn Features On / Off).
- Whether to show only approved / not approved time-track or both of them
When ‘Time- Track Approval’ feature is turned OFF, information on approved time is hidden in the report (see section Turn Features On / Off).
- Time format to be used in the HTML report – either decimal format (##.##) or hours / minutes format (HH:MM)
This option is not applicable to the reports in CSV format. Reports in the CSV format always use decimal format for time data.
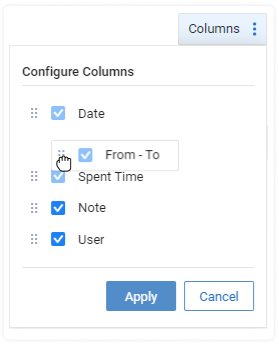
- Information to show in the staff performance report columns
 Report Columns Selector
- Date range – you can use one of predefined date ranges or configure a custom date range
Time Balance & Overtime Report
Time Balance & Overtime report shows users’ and teams’ time balances and overtime values for the selected date range.
Managers will see information for users from their team, while regular users will see their personal data only.
 Example of a Time Balance & Overtime Report
When Overtime feature is disabled in the Turn Features On / Off interface, you’ll see the Time Balance Report instead of the Time Balance & Overtime Report. All saved reports with overtime data will be unavailable.
You can configure the report to display time balances, overtime values, or both.
Time balance is calculated as the difference between the number of hours required by the corporate or the individual work schedule, and time actually reported by the employee.
When pointing the cursor over the reported time value, work and leave time totals are shown.
Note that leave time data is only displayed in the report when Leave Time Tracking feature is enabled in the Turn Features On / Off interface.
Overtime data includes overtime values automatically calculated by the system and manually entered by the user.
Overtime is calculated by the system according to the formula:
Auto-calculated overtime= ∑(Hours worked for nonworking days)+ ∑((Hours worked for working day)+(Leave Time)–(Workday duration))
Overtime reported by user is only shown for those users who are allowed to enter overtime manually.
The system applies the following rules when calculating overtime automatically:
- All working hours submitted for nonworking days are considered as overtime.
- When the sum (time-track + leave time) reported by a user for a working day exceeds workday duration set up for this user, the time exceeding workday duration is considered as overtime (but no more than hours worked for this day).
- If the sum (time-track + leave time) reported by a user for a working day is less than workday duration set up for this user, then overtime is considered to be 0:00.
- If leave time tracking is turned off in the system settings, all leave time is ignored (even if users had reported some leave time before its tracking was turned off).
Note that overtime can only have positive values. If a user reports less time than scheduled, negative values are shown in the Time Balance section.
You can create the report in HTML, export it into CSV, or print it out as a PDF document.
Time Balance & Overtime Report Parameters
Time Balance & Overtime report parameters include:
- Date range
You can select a predefined date range or specify a custom one.
- Data grouping options
Up to 2 data grouping levels are available in the report. You can choose between users, user groups, and time periods on each level.
- Selected staff
Managers can select all staff, any departments or time zone groups, or only specific employees. Use predefined filtering options (select all, deselect all, show selected users only ) and search necessary users by name ().
This setting is not available for regular users without management permissions.
- Report columns
The report can be configured to display scheduled vs. reported time balance, overtime, or both. You can also configure it to show working and leave time in separate columns.
- Time format
For HTML reports, you can choose either decimal format (##.##) or hours/minutes format (HH:MM). For CSV reports, decimal format is always applied.
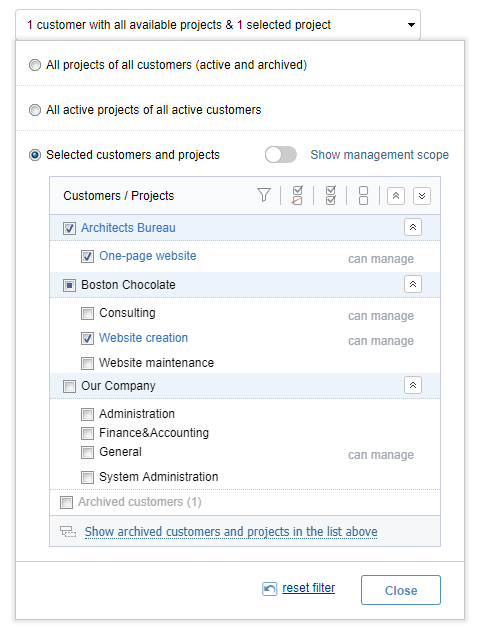
Customers and projects to be included in the report
To see archived customers and projects in the customers and projects selector, select ‘Show archived customers and projects…‘ checkbox above the list of customers and projects.
Customers and projects from your management scope are marked with ‘Can manage’ note.

Customers and Projects Selector
If you select a customer when option ‘Show archived customers and projects…‘ is not selected, archived projects of this customer will not be shown in the report.
Leave Time & Balances Report
This report provides you with information on leave time reported for the selected leave types by actiTIME users. Managers will see information for users from their team, while regular users will see their personal data only.
 Example of Leave Time Report
Leave Time & Balances Report is available in actiTIME interface only when ‘Leave Time Tracking‘ feature is turned ON (see section Turn Features On / Off).
Leave time & balances information presented in the report includes:
- Total leave time reported for the selected leave types within the specified date range
- Time reported for each of the selected leave types within the specified date range
- PTO Balance as of the beginning and the end of the specified date range
- Sick Days Balance as of the beginning and the end of the specified date range
Note: Leave time & Balances report shows information on users’ PTO & Sick Days balances calculated for the first and the last day of the selected date range, when ‘PTO Balance Calculations‘ and ‘Sick days Balance Calculations’ feature is turned ON in Turn Features On / Off interface and you have ‘Manage PTO & Sick days Settings‘ permission.
Tip: You can configure each Leave Type to be calculated as PTO, Sick Days or none in the Leave Types interface.
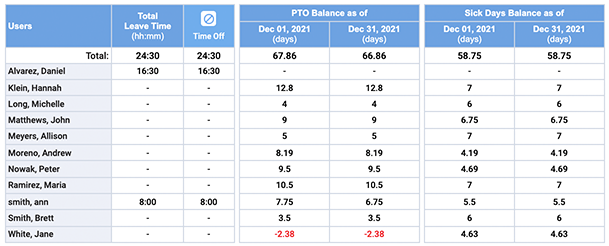 Example of Leave Time & Balances Report, with PTO & Sick Days Balances shown
For detailed information on PTO and Sick Days please see How to Manage Paid Time Off and Sick Days Settings section.
Report results can be grouped by users, by departments, by days, weeks, or calendar months, depending on what data you need to summarize.
The following filters are available for the Leave Time & Balances report:
- Date range
- Selected Staff – you can create a report for all staff or only for the selected system users and departments.
- Leave types – you can create a report for all leave types users reported time for or for the selected leave types.
- Leave Time and/or Balances.
Leave Time & Balances Report Parameters
 Leave Time & Balances Report form
Parameters of Leave Time & Balances Report include:
- Date Range – you can use one of pre-defined date ranges or configure a custom one.
- Users to generate report for – all or selected actiTIME users, departments and time zone groups.
This setting is available to managers only.
- If you select option ‘All Staff‘, report will show information for all users who entered leave time for the selected leave types within the specified date range.
Tip: Set ‘Include users without reported time’ checkbox in this filter, if you need to show users who did not reported leave time within the selected date range.
- If you select specific departments or time zone groups, the report will show information for all users from these departments or time zone groups who entered leave time for the selected leave types within the specified date range.
- If you select specific users, all selected users will be shown in the report even if some of them did not enter leave time within the selected date.
To view only selected users in the user selector click on icon.
 View selected user only in the user selector
To search users by name click on icon and start typing user name.
 Searching users by name in the user selector
To show users with disabled access in the ‘Selected Staff‘ list set the ‘Show users with disabled access‘ checkbox under the list.
- Leave types to generate report for – all or selected leave types.
 Leave Type Selector
Tip: To see archived leave types in the selector, set the ‘Show archived leave types…‘ checkbox under the list of leave types.
- Data grouping options
- Time format to be used in the HTML report – either decimal format (##.##) or hours/minutes format (HH:MM).
Note: This option is not applicable to the reports in CSV format. Reports in the CSV format always use decimal format for time-track data.
- Columns to be shown in the report – when you have ‘Manage PTO & Sick Days Settings’ permission, you can choose which information should be shown in the report columns:
- Leave Time & Balances
- Leave Time only
- Balances only
Additional configuration options of the Leave Time & Balances Report allow you including following balance types in your report:
- Show PTO & Sick Days Balances
- Show PTO Balance
- Show Sick Days Balance
The report to be generated is shown on the preview. You can change its parameters and set the appropriate configuration.
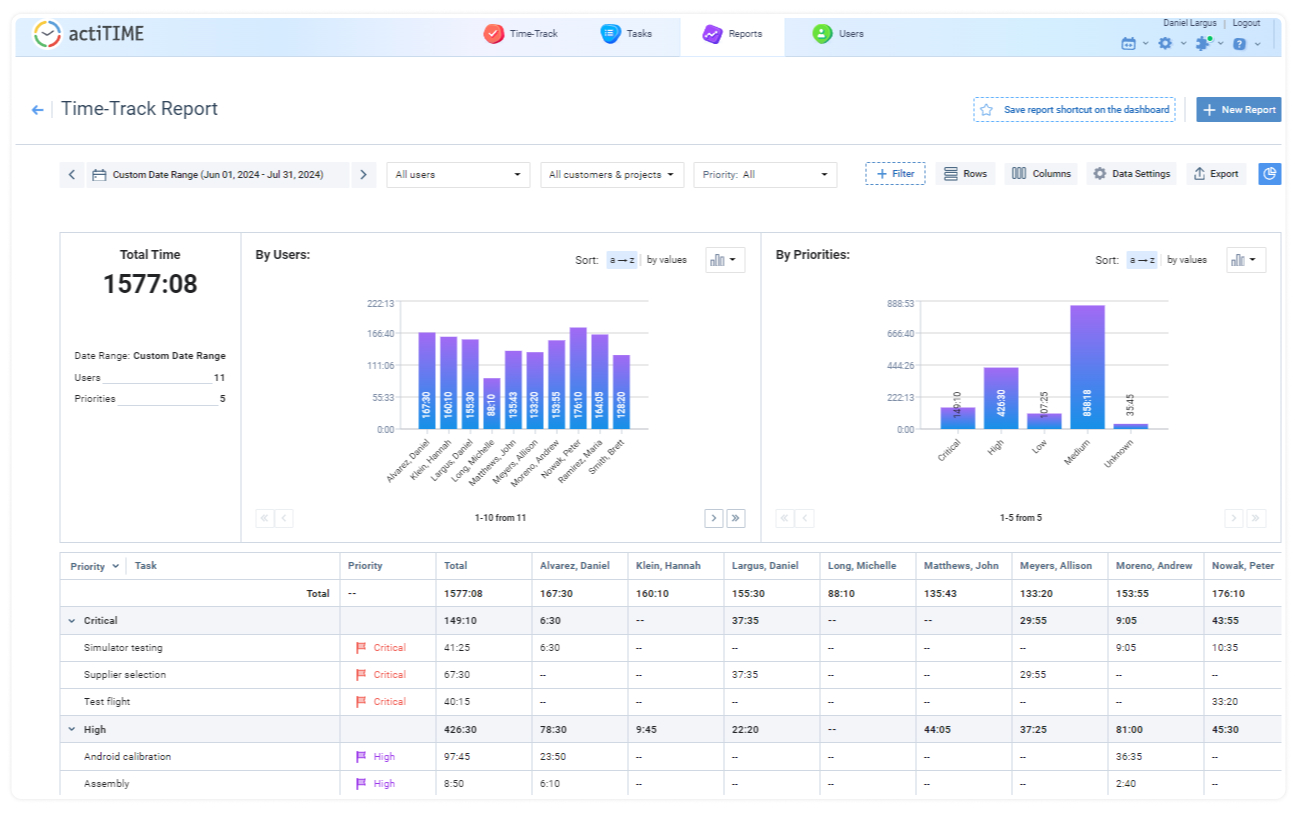
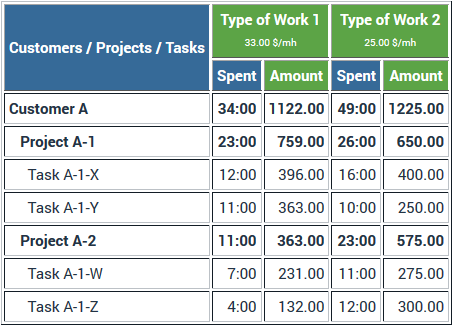
Time-Track Report
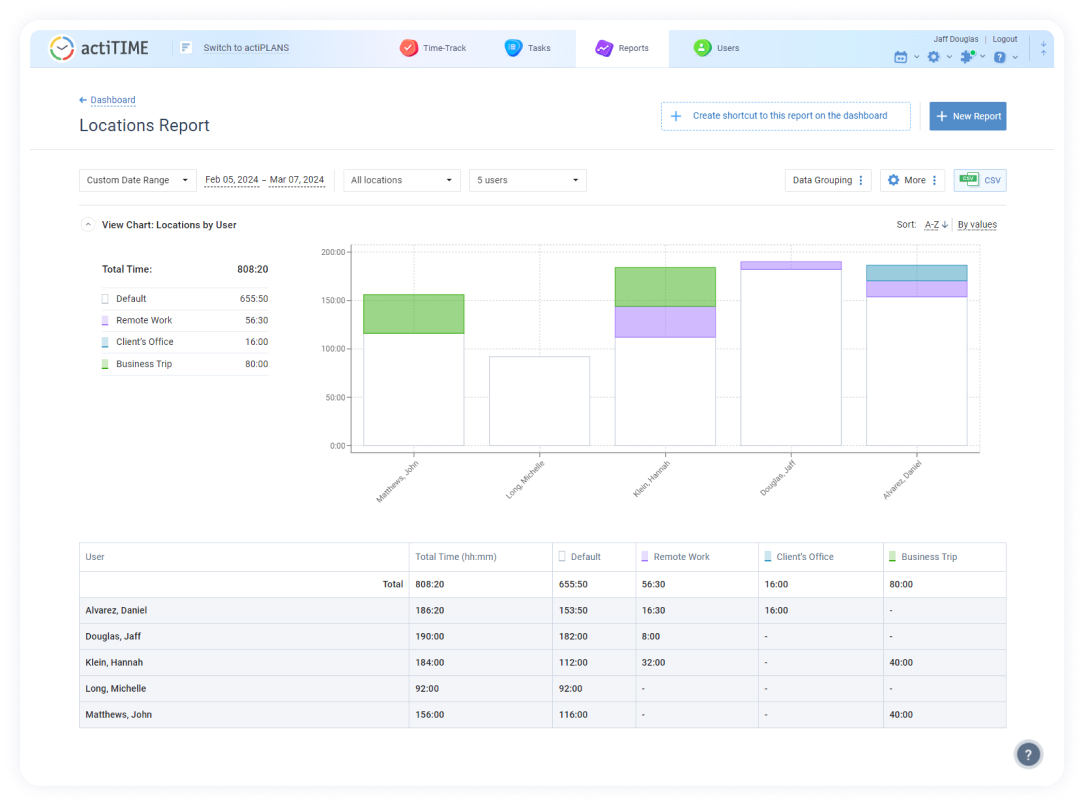
The Time-Track report lets you group, visualize, and analyze the data on how your team members allocate their time between various projects and tasks within the specified period.
Data available in the report depends on user permissions and assigned scope. Managers can run this report on their assigned team, while regular users see their own hours.
The Time-Track Report allows you to select the period to display the data from the menu in the upper-left corner of the screen.
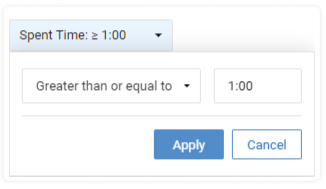
You can also sort the data by tasks, projects, customers, date, etc., and filter it by users, customers, projects, and priority by selecting accordingly.
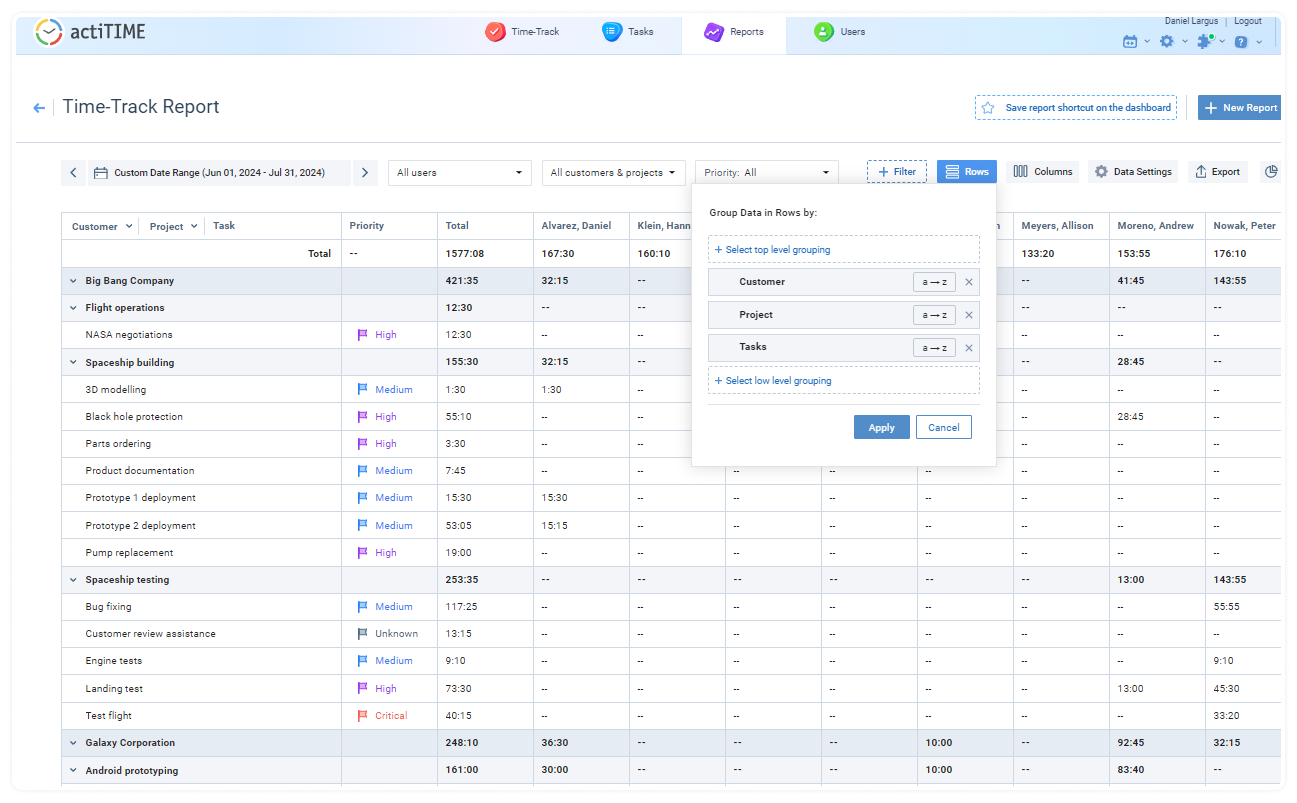
For a more straightforward analysis, you may group data in different rows and columns as needed.
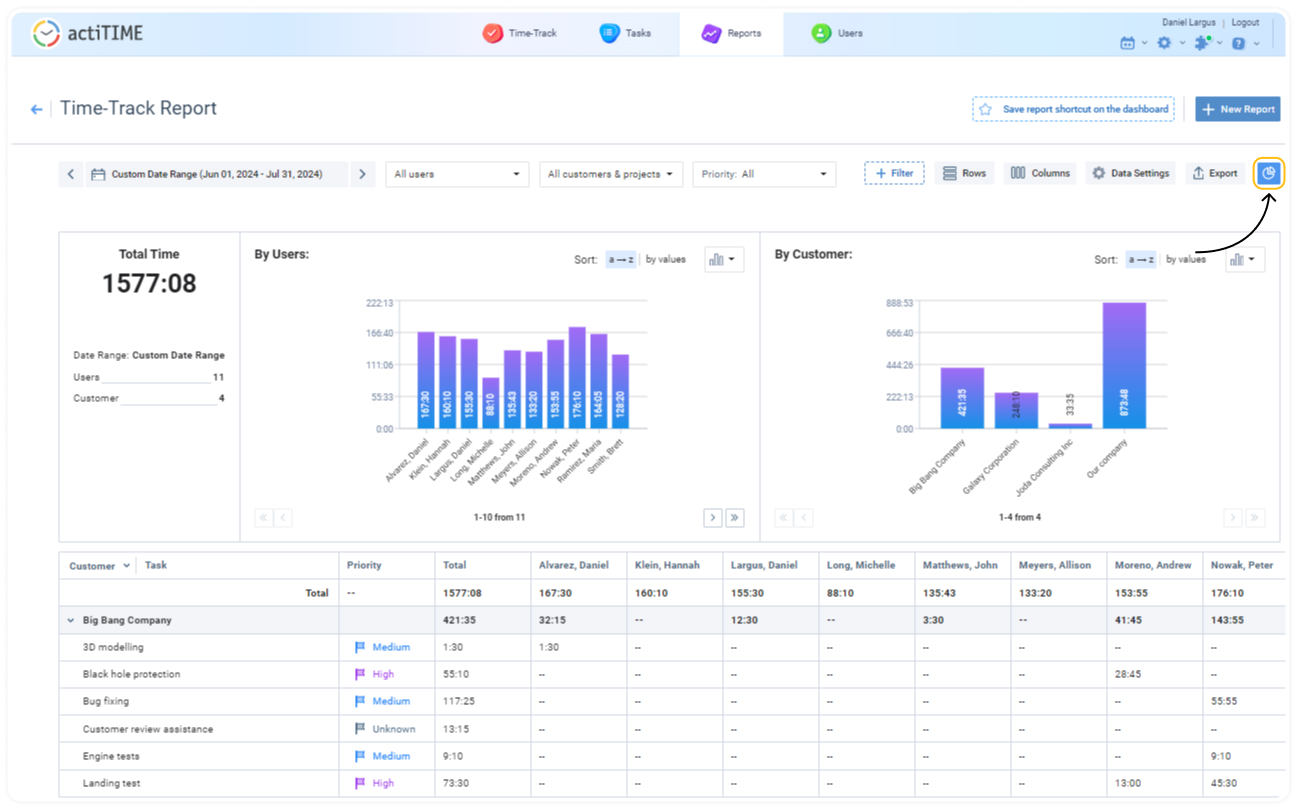
The report also allows you to generate charts with the selected datasets for higher-level visualization and reporting. To create a chart, select the period and the data to be displayed and click on the Chart icon at the top-right corner of the screen.
Thus, you can prepare perfect reports for your seniors and customers. To export the report in CSV, XLS, or PDF format, click on the Export icon at the top-right corner of the screen.
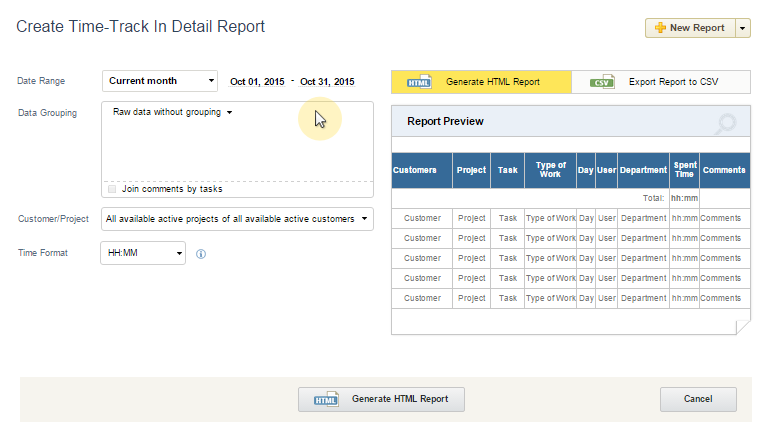
Time-Track In Detail Report
Time-Track in Detail report provides the most detailed timesheet information including user comments on the reported time.
Data available in the report depends on user permissions and assigned scope. Managers can run this report on their assigned team, while regular users see their own hours. For more details, please see Permissions Required to Run a Report section.
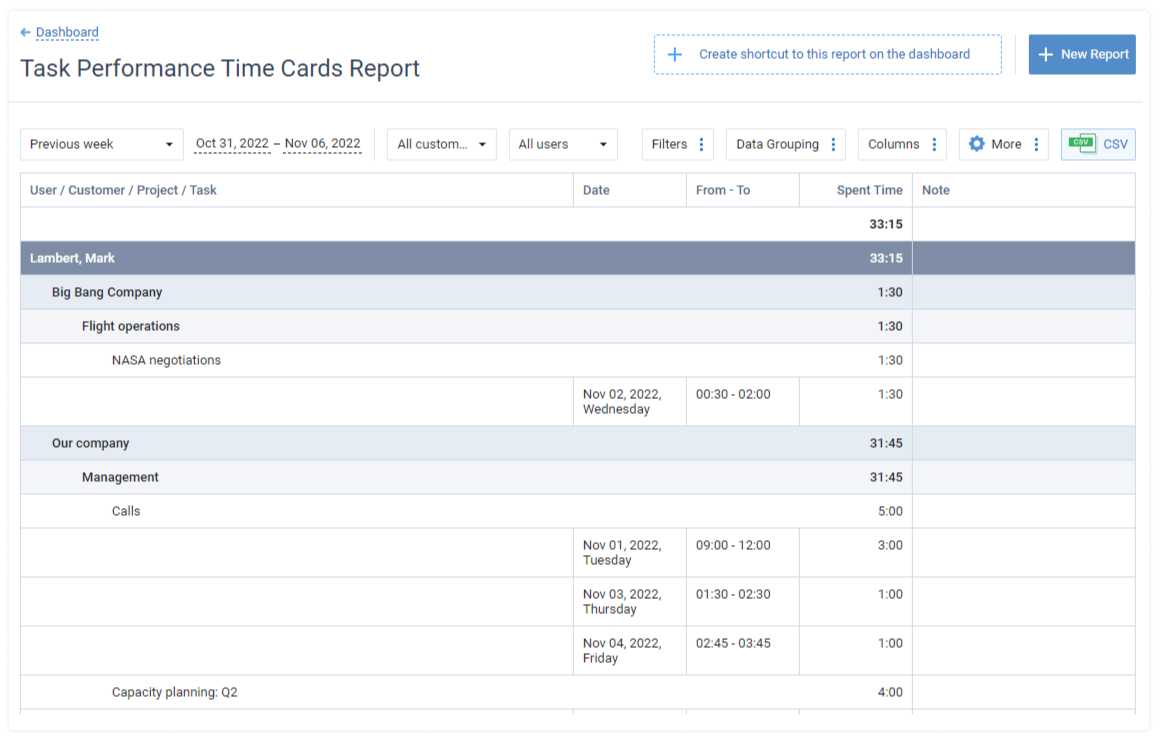
 Example of Time-Track In Detail report
Time-Track in Detail report allows you joining reported time and comments by tasks. If this option is selected, columns Date and User are hidden (if they are not selected as grouping options), and columns Spent Time and Comments contain aggregated values.
 Example of Time-Track In Detail report(with two levels of data grouping and comments joined by tasks)
You can also use plain report format if you need raw data.
 Example of Time-Track In Detail report, plain report format
Tip: actiTIME automatically calculates subtotals for grouping levels when grouping report records.
Time-Track In Detail Report Parameters
To represent data in the most detailed way, the Time-Track in Detail Report offers many data grouping and filtering parameters.
- Date range. You can select a preset date range or enter a custom one using calendar.
- Data Grouping Level. Up to three data grouping levels are available in Time-Track in Detail Report.
By changing data grouping order, you can summarize your data by different parameters.
If you need data on what projects are the most time-consuming and what users are working on these projects, you can choose grouping by projects, then by users:
If you need information on how users manage their time by spending it on specific tasks, group the data by users, then by tasks, etc.:
Tip: If you have typical projects associated with different customers, you can group report data by project names. Your report will contain data related to each typical project.
If you have typical tasks present in a number of projects, you can group data by task names. Your report will contain data related to each typical task.
Use Join comments by tasks option to group comments by tasks: after applying this option, all comments for a specific task are shown in the row of this task.
Time-Track in Detail Report without joining comments by tasks
Time-Track in Detail Report with joining comments by tasks
- Selected Staff filter.
Managers can choose All Staff or only specific employees from their team. Staff filtering by departments or time zones is also available.
Regular users without assigned teams will be able to access their own data only.
 Selected Staff Selector
- Customer/Project filter.
You can choose all customers and projects or filter data by specific customers and projects. Data for archived customers and projects are also available: to include it in the report, set the ‘Show archived customers and projects…‘ check box above the list of customers and projects.
Note that users can see information only for customers, projects, and tasks assigned to them. Customers and projects from your management scope are marked with “Can manage” note.
 Customers and Projects Selector
Note: If you select a customer when option ‘Show archived customers and projects…‘ is not selected, archived projects of this customer will not be shown in the report.
- Time format to be used in the HTML report – either decimal format (##.##) or hours/minutes format (HH:MM).
Note: This option is not applicable to the reports in CSV format. Reports in the CSV format always use decimal format for time-track data.
Estimated vs. Actual Time Report
Estimated vs. Actual Time report is used to compare the task estimates to the actual time spent on these tasks. It also shows the variance between estimated and spent time.
Data available in the report depends on user permissions and assigned scope. Managers can run this report on their assigned team, while regular users see their own hours. For more details, please see Permissions Required to Run a Report.
This report is available in actiTIME interface only when ‘Task Estimates‘ feature is turned ON (see section Turn Features On / Off).
Spent time and variance between estimated and spent time are calculated as of the date specified in the report parameters.
 Example of the Estimated vs. Actual Time Report, detailed form
Variance between estimated and spent time is calculated as
<Variance> = <Time Estimate> – <Spent Time>
When spent time is less than time estimate, variance is positive and means remaining time budget. When spent time is greater than time estimate, variance is negative and means extra time spent for the task, customer, or project.
Estimated vs. Actual Time report supports up to 3 levels of data grouping and an additional Detail level. The available grouping options include:
- Customers
- Projects
- Projects having the same names (by project names)
- Tasks
- Task having the same names (by task names)
- Types of Work
Grouping by project and task names allows to generate reports on “generic” projects and tasks, i.e. those ones that are usually presented in a number of customers (in case of grouping by project names) and projects (in case of grouping by task names).
actiTIME automatically calculates subtotals when grouping report records.
On the ‘lowest level’ report shows either per-user or per-task data. The report can be configured to hide this information and show only summary records, calculated according to the selected grouping options.
 Example of the Estimated vs. Actual Time Report, summary form(per-user information is hidden)
To access Estimated vs. Actual Time report interfaces, use sub-menu ‘Estimated vs. Actual Time‘ of the top-level menu ‘Reports‘.
Estimated vs. Actual Time Report Parameters
 Estimated vs. Actual Time Report form
Parameters of Estimated vs. Actual Time Report include:
- Customer(s) and project(s) to generate the report for:
To see archived customers and projects in the customers and projects selector, set the ‘Show archived customers and projects…’ check box below the list of customers and projects.
Note that users can see information only for customers, projects, and tasks assigned to them.
 Customers and Projects Selector
If you select a customer when option ‘Show archived customers and projects…‘ is not selected, archived projects of this customer will not be shown in the report.
- Tasks to generate report for – one of the following options:
- open tasks only
- completed tasks only
- all tasks (open and completed)
By default report shows only started tasks that have time estimates. In addition you can configure how to process not started tasks and tasks without estimates:
- If you want to get all time estimates specified for the selected projects – select option ‘Include estimates of not started tasks’
- If you want to see all time spent on the selected project by the specified date (including time spent on the not estimated tasks) – select option ‘Include time spent on the tasks without estimates’
- Time format to be used in the HTML report – either decimal format (##.##) or hours/minutes format (HH:MM).
This option is not applicable to the reports in CSV format. Reports in the CSV format always use decimal format for time-track data.
- Date to calculate spent time and variance between estimated and spent time on.
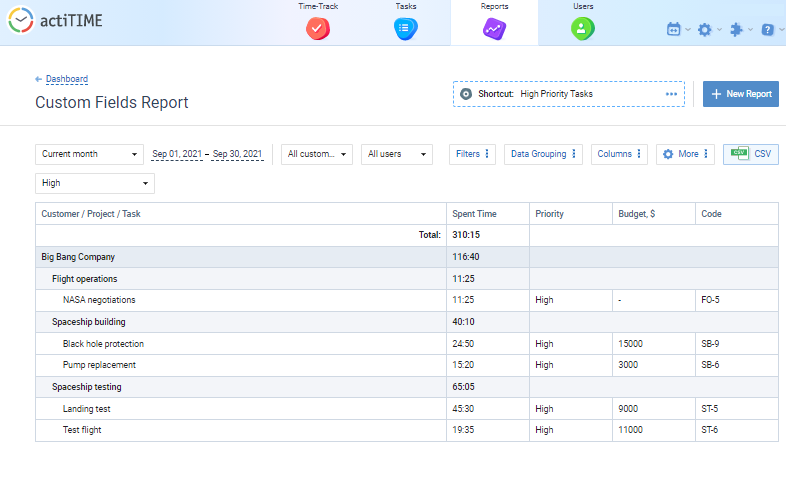
The Custom Fields Report helps you analyze time tracking data linked to various custom task attributes you’ve created in your actiTIME account.
This report has a highly flexible configuration. You can:
- Choose a preferable date range for the analysis
- Filter your data by users, projects or customers
- Sort it by specific task attributes or exclude some custom fields from the view
- Change the order and quantity of columns
- Select one of the two available time formats for your data: HH:MM or ##.##
- Include tasks without time-track in the view
- Make the report as detailed as you want it to be via the data grouping settings
To run the report, follow this route: Reports Dashboard → + New Report → Custom Fields Report.
Once opened, you can change the report’s default data settings to your preferred ones. Plus, you can download the configured report as a CSV file or save it as a shortcut to the Reports Dashboard.
To run the Custom Fields Report, a user has to have one of the following permissions:
- Manage Accounts & Permissions
- Modify & Approve Users’ Time-Track
- Manage Scope of Work
- Manage Cost & Billing Data
- Enter Time-Track
How to Create a New Chart
To generate a new chart, click on the Create Chart button in the upper right corner of the Reports Dashboard.
Data Groups and Filters
You may need to filter and group the data for your timesheet charts, in order to include only the necessary data and to arrange it properly. Create Chart interface provides a view of your chart and contains settings for data grouping and filtration.
Please note that if there are zero values for specific data groups – users, departments, customers, projects etc. – these data groups will not be included in the chart.
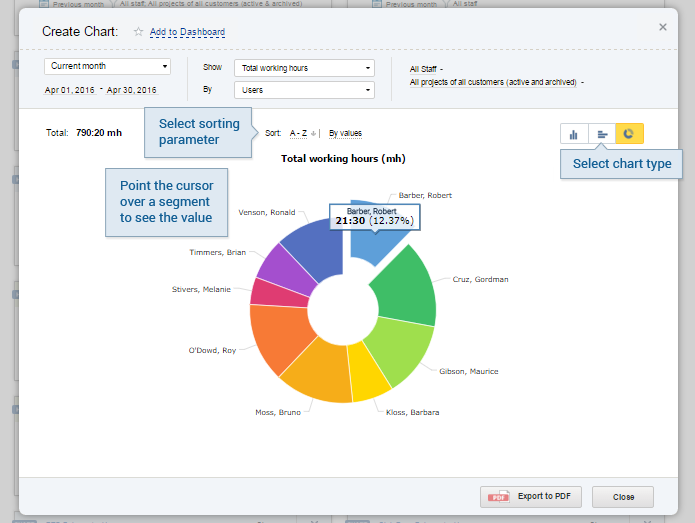
How to Customize Your Chart
Once the chart is created, you may need to choose the best way to visualize your data. Chart customization interface is simple and intuitive. You can choose sorting parameters, color schemes and chart types – vertical bar graph, horizontal bar graph or doughnut chart.
For example, doughnut charts suit the best to illustrate proportions, and bar graphs are appropriate when you need to show comparisons. Sorting is also important: arranging the values in alphabetical order makes it easier to find the necessary value, and sorting by values allows easy ranking of data groups.
Tip: You can add your chart to dashboard to access it faster in the future. It will also allow you creating similar charts later, only changing some parameters (e.g. date range).
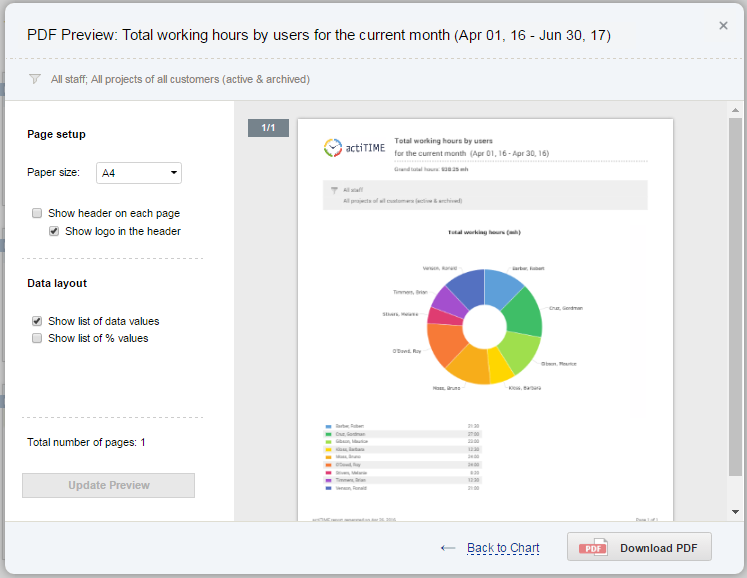
How to Save Your Chart
Click on Export to PDF button in the bottom of the window to create a PDF document with your chart. Now you can print, share, send the chart by email etc.
A preview form allows you configuring paper size, header and data list parameters. After changing these parameters, click Update Preview to see the changes.

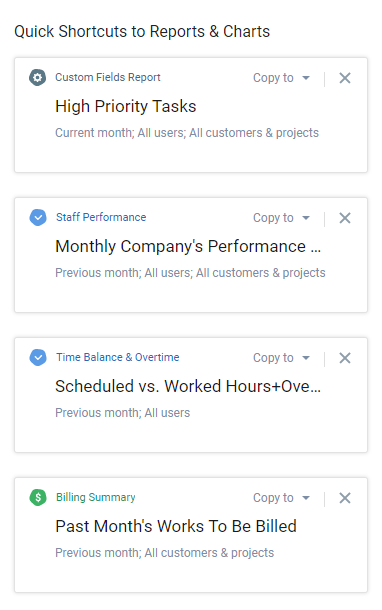
Quick Shortcuts to Reports & Charts
Quick Shortcuts to Reports & Charts let you save the configuration of the most frequently used actiTIME reports and then create any of them in just one click.
All the shortcuts are available on the left side of the Reports Dashboard by default. Newly added shortcuts always appear at the top of the list, although you can easily change their sequence with the help of the drag-and-drop editor.
 Quick Shortcuts to Reports & Charts
How to Create a Shortcut
To add a shortcut to the dashboard, hit the + New Report button and select a report you want to save as a template. After configuring preferable data settings, click on Add to Dashboard as Shortcut, and the template will appear at the top of the shortcuts list.
Create new report that you want to save as a template
In the same manner, you can create a shortcut to a chart by clicking on the Create Chart button.
How to Edit a Shortcut
To modify data configuration in a shortcut, click on it to open a saved report and press on the Edit Configuration button. After changing the settings, you can save them as an entirely new shortcut or just update the existing one.
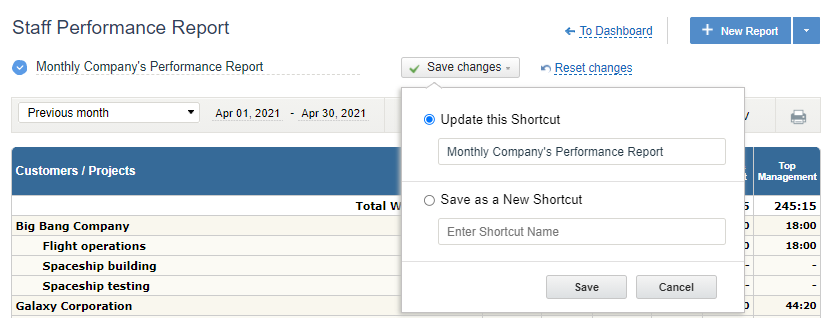 Update a shortcut
In addition, you can rename or delete a shortcut by clicking on a 3-dot icon next to its name in the upper right corner of the saved report.
How to Share a Shortcut
You can share the created shortcuts with other actiTIME users. To do so:
- Locate a necessary shortcut on the Reports Dashboard;
- Press on the Copy to button to open the user selector window;
- Type the name of a sought-for employee in the search field or select them from the list of users;
- Once done, the specified employee will be able to access your shortcut right from their own Reports Dashboard.
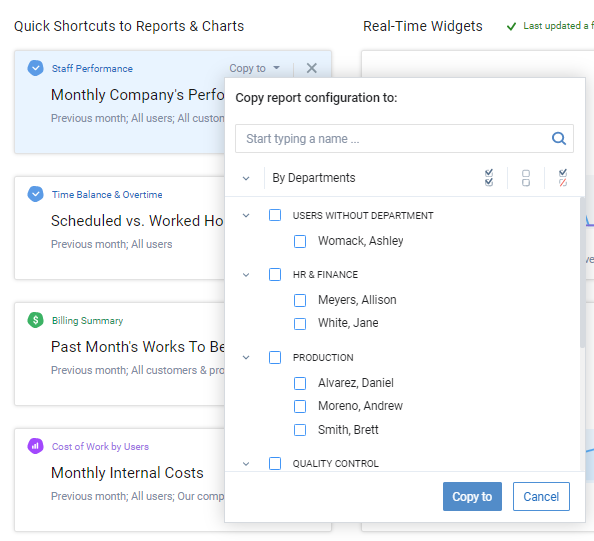 Share a shortcut with a colleague
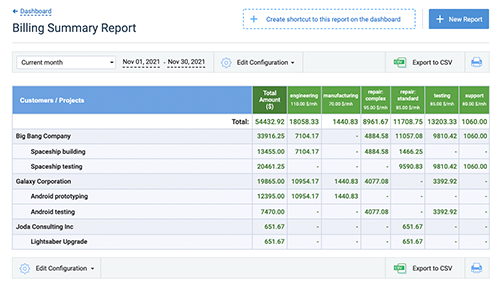
Note: Shortcuts to certain types of reports can only be shared with those assigned relevant data access permissions. For instance, you can copy the Billing Summary Report to a colleague’s Reports Dashboard merely if they have the “Manage Cost & Billing Data” permission.
Visit this page to check the complete list of permissions one needs in order to run different reports in actiTIME.
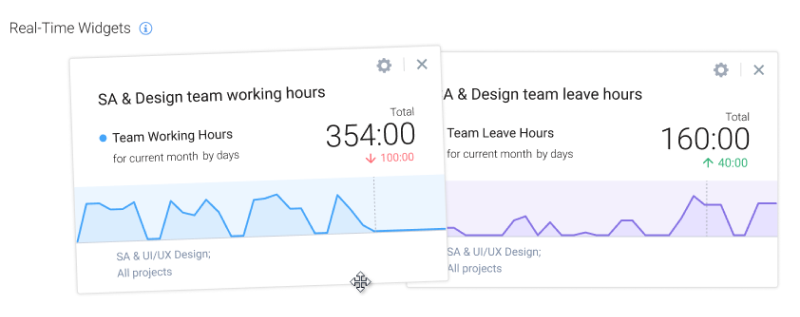
Real-Time Widgets
actiTIME’s report widgets display your time-track results on visually striking sparkline charts. They capture data changes in real time and automatically update the information every 5 minutes. The widgets also indicate if your performance trends go up or down, whereas the handy in-built tooltips allow for effortless data interpretation.
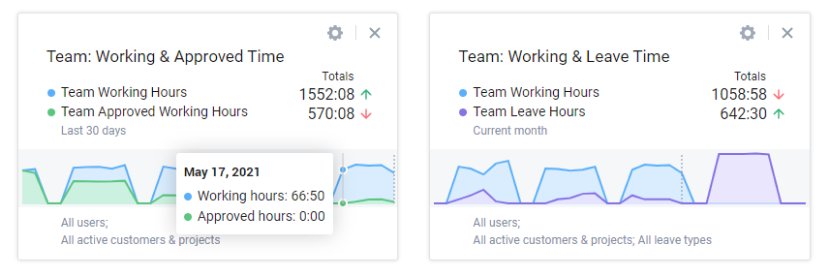 Real-time report widgets
You can create widgets for the following types of time tracking data:
- Working hours
- Approved working hours
- Leave hours
- Working hours vs. approved working hours
- Working hours vs. leave hours
Note: If functionality for Leave Time Tracking and Time-Track Approval is switched off, you cannot see the information on approved working hours and leave hours in your real-time widgets.
Besides, in order to review all other users’ working hours and leave hours, one needs to have the following two permissions: “Manage PTO & Sick Days Settings” and “Manage Accounts & Permissions.” Users with the right to “Modify & Approve Users Time-Track” can see the data of their assigned teams only, while regular users with the “Enter Time-Track” permission alone can see merely their personal data.
How to Create a Real-Time Widget
To add a new widget to the dashboard, locate the Create Widget button in the upper right corner of the interface. Press on it and enter the following information in the opened pop-up window:
You can create widgets for the following types of time tracking data:
- A widget’s name
- A type of data to showcase: working hours, leave hours, etc.
- A preferable date range: today, current week / month / year, etc.
- A team you want to see the data for
- Customers / projects
- Leave types
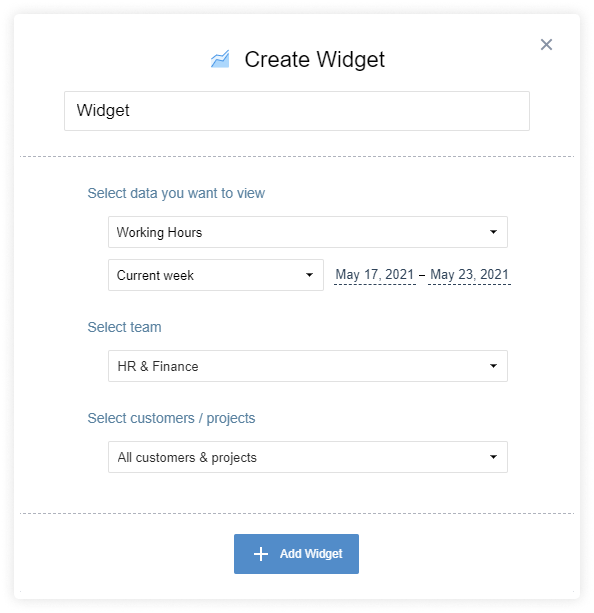 Create Widget
Hit the +Add Widget button whenever you finish configuring the settings, and the newly created widget will immediately appear on the Reports Dashboard.
How to Edit a Real-Time Widget
To edit a widget, click on the settings icon right above its name on the dashboard.
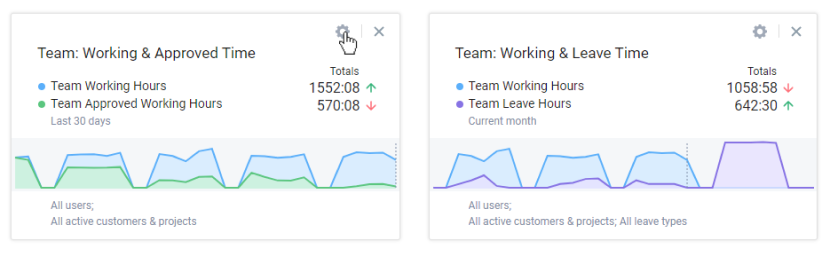 Edit a real-time widget
Make the necessary configuration changes in the opened pop-up window and press the Save button once done – the data in your real-time widget will be updated accordingly right away.