Marketing productivity is the ratio between what marketing produces (revenue, pipeline, qualified leads) and what it consumes to produce it (budget and people’s time). Most teams measure the top half of that ratio in detail and barely measure the bottom half. They know the cost per lead to the cent and have no idea how many hours went into the campaign that produced it.
This guide covers how to measure marketing productivity on both sides of the ratio, which marketing productivity metrics are worth tracking, a worked example of where a team’s hours go, and seven ways to increase marketing productivity that do not involve asking people to work faster.
- What is marketing productivity?
- What lowers marketing productivity
- How to measure marketing productivity
- Marketing productivity metrics worth tracking
- Worked example: where a content team’s hours go
- 7 ways to increase marketing productivity
- Where productivity efforts go wrong
- Marketing agency productivity: what changes when a client pays
- Tracking marketing hours with actiTIME
- FAQ
- Conclusion
What is marketing productivity?
Marketing productivity measures how much business result marketing gets for each unit of input. The output can be revenue, pipeline, qualified leads or customers acquired. The input is what the team spends to get there: media and tool budget, plus the time of the people who plan, write, design, run and report on campaigns.
The idea has a long academic history. In a 2004 Journal of Marketing paper, Roland Rust and four coauthors described a “chain of marketing productivity” that runs from marketing actions to customer attitudes, then to market share and sales, then to profit and cash flow, and finally to the value of the firm (Rust et al., 2004). The practical point is that a campaign can look productive at one link and unproductive at the next. A promotion can lift this month’s sales and still damage the brand that sells next year.
For a team running campaigns week to week, the useful version is narrower: how much did we get out of the money and the hours we put in, and which of those hours could have gone somewhere better?
What lowers marketing productivity
Budget pressure is part of the picture. Gartner’s 2026 CMO Spend Survey of 401 marketing leaders in North America, the UK and Europe found marketing budgets at 7.8% of company revenue in 2026, up from 7.7% in 2025, with 56% of CMOs saying they lack the budget to deliver their strategy and 54% reporting insufficient resources (Gartner, 2026). When the money stays flat, the only input left to work on is time.
Time is where most of the loss sits. Asana’s Anatomy of Work Index 2021, a survey of more than 10,000 knowledge workers, found that people spend 60% of their day on “work about work” such as status updates, searching for information and switching between tools, rather than on the skilled work they were hired for (Asana, 2021). The figure covers knowledge workers in general, not marketers specifically, but anyone who has run a campaign through four approval rounds will recognize it.
In practice, five things drag marketing productivity down most often:
- Too many things in progress. A team running eight campaigns at once finishes each of them later than a team running four, because every switch between them costs time.
- Unclear briefs. Work that starts without an agreed goal, audience and approver comes back for rework, and rework is the most expensive hour in marketing because it produces nothing new.
- Revision rounds without a limit. Each extra round adds hours from the writer, the designer and the reviewer.
- Meetings that replace written updates. A weekly status meeting for eight people costs eight hours, every week, to share what a task board already shows.
- Channels that nobody stops. Programs keep running because they always have, while nobody counts the hours they consume against what they return.
How to measure marketing productivity
To measure marketing productivity properly, track three layers and connect them: inputs, outputs and cost. Most reporting stacks cover outputs well. Inputs and cost are where teams go blind.
-
Inputs: hours by campaign, channel and type of work.
Record how many hours go into each campaign or client, and split them by type of work: production, revisions, meetings, reporting, admin. Without this split you can see that a team is busy but not what it is busy with.
-
Outputs: what shipped and what it produced.
Count deliverables (assets published, campaigns launched) and business results (qualified leads, pipeline, revenue). Keep the two apart. Shipping more assets is not the same as producing more pipeline.
-
Cost: money plus time, converted to the same unit.
Multiply hours by a loaded hourly rate (salary plus benefits and overhead, divided by working hours) and add it to media and tool spend. Now cost per lead or cost per asset includes the people who made it.
-
Connect the layers per campaign.
For each campaign or channel, put hours, total cost and result on one line. That line answers the questions that matter: which channel returns the most per hour, and which one quietly eats the team’s week.
Long sales cycles complicate the output side. Spend in one quarter often shows up as revenue in the next, so judge channels on leading results (qualified pipeline) monthly and on revenue quarterly or later.
Marketing productivity metrics worth tracking
There are dozens of marketing KPIs. The ones below were chosen because each connects output to input, which is what makes it a productivity metric rather than an activity count. The first table covers results per dollar; the second covers how the team’s time turns into finished work.
Result metrics: what marketing returns per dollar
| Metric | How to calculate it | What it tells you |
|---|---|---|
| Marketing efficiency ratio (MER) | Total revenue / total marketing spend | How much revenue each marketing dollar sits behind, across all channels at once |
| Customer acquisition cost (CAC) | Marketing and sales cost, labor included / new customers | What one new customer really costs once salaries are counted |
| LTV to CAC ratio | Customer lifetime value / CAC | Whether acquisition pays for itself over the customer relationship |
| Cost per qualified lead | Channel spend + channel hours x loaded rate / qualified leads | Which channel produces leads cheapest once hours are included |
| Pipeline per marketing hour | Marketing sourced pipeline / hours logged on marketing work | How much opportunity value each hour of team time creates |
| Lead to opportunity rate | Opportunities / qualified leads | Whether lead volume is real or padding |
Flow metrics: how time turns into finished work
| Metric | How to calculate it | What it tells you |
|---|---|---|
| Cycle time | Days from approved brief to launch | How fast the team can respond and iterate |
| Hours per deliverable | Hours logged on a deliverable type / number shipped | The real effort behind a blog post, a webinar or a landing page |
| Production share of hours | Hours on production / all hours logged | How much of the week goes into work that ships |
| Revision rate | Revision hours / production hours | How much effort goes into redoing work; high values point to weak briefs |
| Estimate accuracy | Actual hours / estimated hours per task | Whether the team can commit to dates it will keep |
| On time completion rate | Tasks finished by deadline / tasks due | Reliability, which matters most when launches depend on each other |
Website traffic, social engagement and email open rates still belong in channel reports. They describe reach. None of them says what that reach cost, so on their own they cannot tell you anything about productivity. For a broader list of business KPIs outside marketing, see our guide to essential business metrics.
Worked example: where a content team’s hours go
The numbers below are illustrative, but the pattern is typical of what a team sees in its first month of logging hours by type of work. A content team of four logs 600 hours in a month at a loaded rate of $55 per hour and ships 18 assets.
Sensitivity: if only half of the target is reached and 45 hours are freed, the team ships 21 assets at $1,571 each. At a loaded rate of $70 instead of $55, the same change moves cost per asset from $2,333 to $1,750. In every case the payroll stays the same; what changes is the share of the week that ends up in finished work, from 45% to 60% in the main scenario.
The calculation only works if the hours are recorded by type of work. A team that logs “8 hours, marketing” every day cannot run it.
7 ways to increase marketing productivity
If you want to boost marketing productivity without a bigger budget, these are the changes that move the numbers. Each one helps improve marketing efficiency by shifting hours from coordination into output, or by cutting output that is not worth its hours.
-
Limit work in progress.
Set a cap on how many campaigns or assets each person can have open at once, and finish before starting. A shorter queue cuts switching costs and shortens cycle time without anyone working longer hours.
-
Write the brief before the work starts.
A one page brief with goal, audience, key message, deliverables, deadline and a named approver prevents most rework. Our creative brief template covers the fields that matter.
-
Cap revision rounds.
Agree on two rounds per deliverable by default, with all feedback collected from all reviewers in each round. A third round should need a reason, and it should be logged as revision time so the cost stays visible.
-
Replace status meetings with a shared task board.
If task statuses, owners and deadlines are visible to everyone, the weekly status meeting can become a short call about blockers. Keep meetings for decisions. Our guide to efficient meetings has more on that.
-
Track hours against campaigns and estimates.
Log time to the campaign and task it belongs to, with an estimate on each task. After a month you know the real hours behind each deliverable type, and your estimates start to match reality.
-
Reallocate from channels with the worst cost per result.
Rank channels by cost per qualified lead with hours included. The bottom one or two usually look acceptable on media spend alone and poor once team time is added. Cut them or rebuild them, then move the hours to the top performers.
-
Automate and template the repeatable parts.
Recurring reports, email sequences, social scheduling and lead routing are good candidates. See our roundup of marketing automation tools for options. Templates for recurring deliverables also cut the setup hours on every new campaign.
Skills still matter. A team that knows its audience and its channels wastes fewer hours on work that misses, and our list of digital marketing skills is a good place to look for gaps. But training takes months to show up in results, while the seven changes above show up in the next month’s hours.

Where productivity efforts go wrong
Most failed productivity pushes in marketing fail in one of these ways:
- Counting activity as output. More posts, more emails and more campaigns raise the activity count and can lower productivity if each one returns less.
- Leaving people costs out of ROI. Return on ad spend divides revenue by media cost only. A channel with a strong ROAS can still lose money once the hours of the people running it are counted.
- Using hours to police people. Timesheets used to check who worked the most hours produce padded timesheets. Used to find out where campaigns spend their time, they produce useful data. Say which one you mean before you start.
- Targeting 100% utilization. A team booked for every hour has no room for urgent requests, so urgent requests push scheduled work late. Planning around six productive hours in an eight hour day leaves room for the requests that always arrive.
- Judging channels too early. Brand work and long sales cycles show results months later. Cutting a channel after four weeks often removes something that was working.
- Adding a tool for every problem. Every new tool adds logins, switching and another place to look for information. Check whether an existing tool already covers the need before buying another one.
Marketing agency productivity: what changes when a client pays
For a marketing agency, productivity has a direct price. Every hour spent on a client either gets billed, fits inside a retainer, or comes out of margin. That changes which metrics come first:
- Billable share of hours: billable hours divided by all hours logged. Our guide to resource utilization metrics covers the formulas and benchmarks.
- Retainer burn: hours used against hours sold each month, per client. Over servicing a retainer is the most common way agencies lose money without noticing; our roundup of marketing project management software works through what it costs.
- Effective hourly rate per client: fees received divided by hours spent. Two clients paying the same retainer can end up with very different effective rates if one of them needs twice the hours.
The benefits of time tracking for agencies are covered in more depth in time tracking for marketing agencies, and the process side in our guide to the marketing project management process. When an agency is ready to grow, the same numbers decide whether to hire; see how to scale your marketing agency.
Tracking marketing hours with actiTIME
actiTIME is project time tracking software built for billing. For a marketing team or agency, it supplies the input side of the productivity ratio: hours by client, campaign, task and type of work, and what those hours cost or earn.
Work is organized as customer, project and task, so a team can set it up as client, campaign and deliverable. People log hours in a weekly timesheet or a calendar view, from the mobile app, or with the Chrome extension. Each task carries an estimate, a deadline, a priority and a workflow status, and the Kanban board shows where work is stuck.
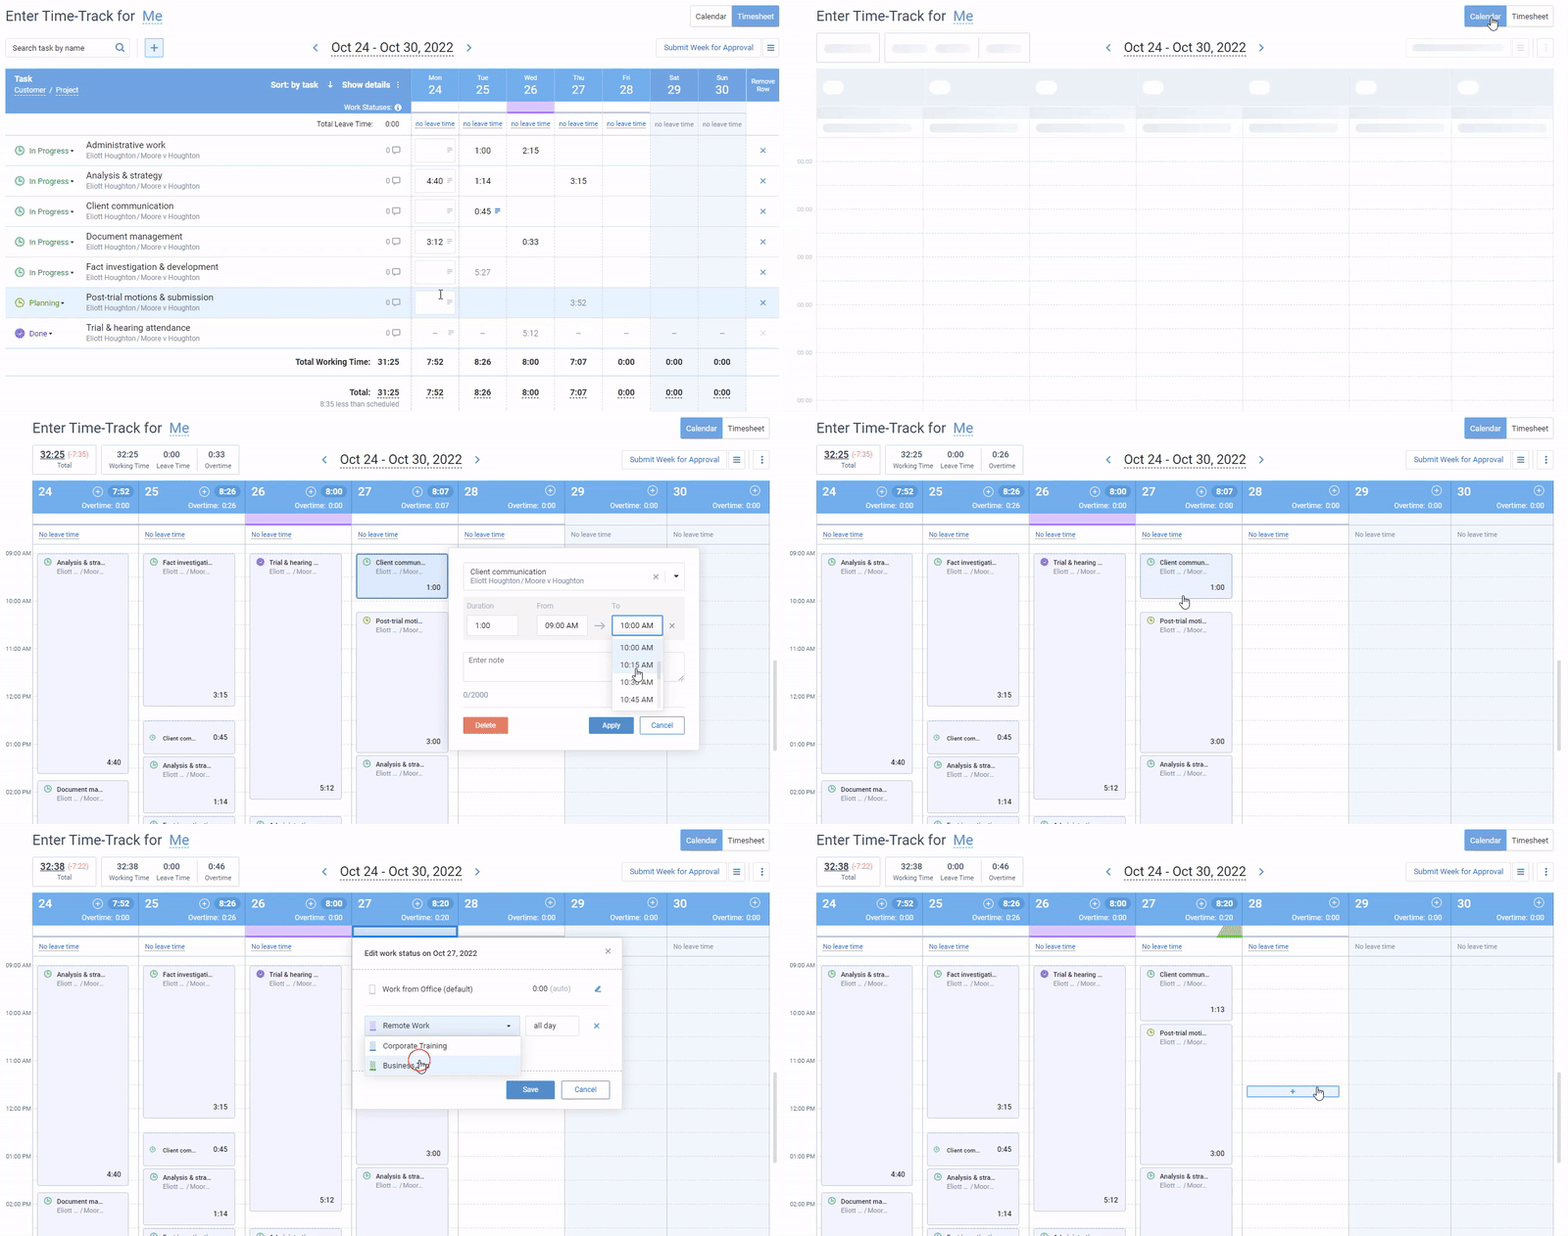
The reports cover the calculations in this guide:
- Time-Track Report groups hours by customer, project, user or type of work, so you can see the split between production, revisions and meetings.
- Estimated vs. Actual Time Report shows where tasks ran over and by how much.
- Cost of Work Report turns hours into labor cost using each person’s cost rate.
- Billing Summary Report and PDF invoices turn billable hours into client bills, using rates by type of work or by individual user, chosen per project.
- Budgets for time, cost and billable amounts can be set on a client, campaign or task, and the progress bar turns red when a budget is exceeded.

actiTIME costs from $5 per user per month, and teams of up to 3 users can use a free version. A self-hosted version is available for a one-time fee.

actiTIME helps us in data analysis and international reporting
actiTIME is pretty easy and understandable even for a layman. The app requires no big technical know-how. Simple user interfaces and stylish reporting became vital factor in making a decision on the application. It helps us a lot in data analysis, client billing and international reporting. There has been a tremendously positive impact on the process since we’ve been using the product!
FAQ
What is the difference between marketing productivity and marketing effectiveness?
Productivity compares output to input; effectiveness asks whether the output moved the business in the right direction over time. Rust and coauthors give the example of price promotions: they can be efficient because they bring short term revenue, yet ineffective if they invite competitor responses and erode brand equity. Track both, and be suspicious of any channel that scores well on one and badly on the other.
What is the 40-40-20 rule in marketing?
It is an old rule of thumb from direct mail, usually credited to Ed Mayer: 40% of a campaign’s result depends on the audience or list, 40% on the offer, and 20% on the creative. For productivity it is a useful reminder that hours spent polishing creative return less than hours spent on targeting and the offer.
What is the 3-3-3 rule for productivity?
It is a personal planning method described by writer Oliver Burkeman: three hours of focused work on your most important project, three shorter urgent tasks, and three maintenance activities each day. For marketers it works as a guard against a day made only of messages and meetings. It is an individual method, so it does not replace team level measures such as production share of hours.
Conclusion
Marketing productivity is output divided by input, and the input is not only budget. Count the hours, split them by type of work, attach a cost to them, and the picture changes: channels that looked cheap turn out to be expensive, and the fastest gains usually come from fewer revision rounds and fewer status meetings rather than from a bigger budget.
If you want to see where your team’s hours go, start a free trial of actiTIME with full features for 30 days. After the trial, teams of up to 3 users can keep using it for free. If you prefer a guided walkthrough, you can also request a demo.