



Do your efforts sometimes fail to bring the results you expected? Do some of your team’s activities remind you of the mountain that brought forth a mouse?
The reason is that effort and results are rarely proportional. Pareto analysis is a simple way to find the few causes, tasks or clients that produce most of your results or most of your problems, so you can decide where to act first. It rests on the Pareto principle, also called the 80/20 rule: roughly 20% of causes account for 80% of effects. The split is an approximation, not a law, but it is a reliable guide to where attention pays off.
Below you will find what Pareto analysis is, how to do it step by step, a worked example with time tracking data and how to use the results in decision making.
What is Pareto analysis
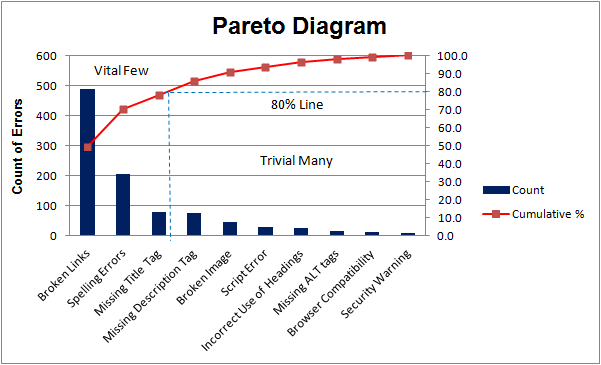
Pareto analysis is a prioritization technique. You sort the causes of a problem or the sources of a result from largest to smallest, calculate the cumulative share of each, and focus on the small group at the top that accounts for most of the total. The result is usually shown as a Pareto chart: bars in descending order with a cumulative percentage line above them.
The idea goes back to the economist Vilfredo Pareto, who observed that about 80% of the land in Italy was owned by 20% of the population. The quality pioneer Joseph M. Juran later applied the pattern to defects and problems in management, and coined the phrase “the vital few and the trivial many”, according to the Juran Institute’s history of Dr. Juran. You will also see it called a Pareto diagram or Pareto chart analysis.
The vital few and the trivial many
The pattern turns up in almost any area of work. The examples below show the shape it often takes. The exact ratios differ from case to case, so treat them as patterns to test with your own data rather than as facts:
- Customer service: most complaints relate to a small number of products or services.
- Team management: most schedule changes come from a few recurring causes.
- Product management: a few products or services bring in most of the revenue.
- Risk management: a small number of hazards account for most incidents.
- Sales: a minority of clients generates most of the profit.
- Project management: a few tasks consume most of the hours or most of the budget overruns.
- Software development: a small share of bugs causes most of the crashes.
This proportion invites some tempting questions. Can I work only 20% of the time if that produces 80% of the outcome? Why not drop the 80% of tasks that bring only 20% of the value?
No, that’s not a good idea. Both sides of the proportion matter. The vital few deserve your attention first, but ignoring the rest would lower the quality and value of the work. Smaller issues don’t need to be solved immediately, yet they still affect quality, customer retention and job satisfaction. The Juran Institute’s own history of Dr. Juran also speaks of separating the vital few from the “useful many”.
How to do a Pareto analysis in 6 steps
The steps below follow the method described by Oregon State University Extension in its guide to Pareto analysis and check sheets, adapted for project and team decisions.
-
Define the problem and the categories.
Decide what you are measuring (complaints, defects, hours, costs) and agree on a fixed list of categories with clear definitions, so everyone classifies items the same way.
-
Collect the data for a set period.
Count how often each category occurs, or how many hours or dollars it represents, over a defined period such as a month or a quarter.
-
Sort categories from largest to smallest.
Rank them in descending order. If you have many small categories, group them into “Other” at the bottom.
-
Calculate each category’s share.
Divide each category’s value by the total and multiply by 100.
-
Calculate the cumulative percentage.
Add each share to the shares above it. The running total shows how much of the problem the top categories explain together.
-
Draw the chart and choose the vital few.
Plot the bars in descending order with the cumulative line on a second axis. The categories to the left of the point where the line reaches about 80% are your vital few. If cost per item differs a lot between categories, weight the counts by cost before you decide.
Pareto analysis example with time data
Suppose a team tracks its time and sees 400 non-billable hours in a quarter. The figures below are illustrative. Sorted by cause, they look like this:
| Cause of non-billable hours | Hours | Share | Cumulative share |
|---|---|---|---|
| Internal meetings | 140 | 35% | 35% |
| Rework after client feedback | 96 | 24% | 59% |
| Admin and reporting | 64 | 16% | 75% |
| Onboarding new hires | 40 | 10% | 85% |
| Tool issues | 28 | 7% | 92% |
| Travel | 20 | 5% | 97% |
| Other | 12 | 3% | 100% |
Three of seven causes explain 75% of the non-billable hours. That is not exactly 80/20, and it doesn’t need to be. The decision is clear: start with meetings and rework, which together take 59% of the hours, before spending effort on travel or tool issues.
The data for an analysis like this comes straight from timesheets. In actiTIME, you can mark types of work as billable or non-billable, group hours by type of work, task or user in the Time-Track Report and export it to CSV to build the chart in a spreadsheet.
Using Pareto analysis in decision making
Decision making often looks intuitive, but you can and should back it with data. Pareto analysis shows which parts of the work need closer attention, more resources or stricter deadlines. Here is how a manager can apply it.
When a few tasks drive most of the results
- Identify the tasks that produce most of the outcome.
- Tackle those tasks first.
- Prioritize the rest so it still gets done on time. Our guide on how to prioritize tasks covers methods for that.
When a few people carry most of the work
- Identify the top performers on your team.
- Spread the workload more evenly so they don’t burn out.
- Assign the most important work to the people best placed to do it.
- Delegate your own work, including some decisions.
- Consider splitting the team into smaller groups with their own share of the work.
When a few issues cause most of the conflicts
- Collect feedback on issues from your team or customers and keep a record of it.
- Find the most frequently reported issues and address them first.
- Make sure the remaining issues are not forgotten.
When a small part of your time is the most productive
This doesn’t mean you can work a fifth of your usual hours. It means some hours are far more productive than others.
- Find out which part of your working time is the most productive.
- Use that time for urgent and important tasks.
- Use productivity techniques to get more value out of the rest.
Pareto analysis tells you where to look. When a decision has several possible outcomes with different probabilities, combine it with decision tree analysis, and for choices that involve the whole team, see these group decision making techniques.
Limitations of Pareto analysis
- It counts frequency, not importance. A rare problem can still be the most expensive or dangerous one, so weight categories by cost or impact when they differ a lot.
- It shows symptoms, not root causes. Once you know which category to fix, you still need to find out why it happens.
- It depends on the categories. Vague or overlapping categories produce a misleading chart.
- It is a snapshot. Repeat the analysis after you act, because the vital few will change.
FAQ
What is Pareto analysis in decision making?
It is a way of choosing what to act on first by ranking causes or options by their impact and focusing on the few that account for most of the total. It helps managers decide where to put time, people and budget.
How do you calculate a Pareto chart?
Count or measure each category, sort them from largest to smallest, divide each by the total to get its share, and add the shares cumulatively. Plot the values as descending bars and the cumulative percentages as a line.
What is another name for Pareto analysis?
It is also called the 80/20 rule or the Pareto principle, and when it is shown as a chart, a Pareto chart or Pareto diagram. Juran’s phrase “the vital few and the trivial many” describes the same idea.
What is the 80/20 rule for project managers?
It is the observation that a small share of tasks, risks or issues usually accounts for most of a project’s results, delays or costs. Project managers use it to decide which tasks to protect, which risks to mitigate first and which problems to fix before others.
Does the split have to be exactly 80/20?
No. The two numbers don’t have to add up to 100 and rarely match exactly. In real data you may see 70/30 or 90/10. What matters is that a small group of causes explains a large part of the effect.
Decide with data, not hunches
The Pareto principle is an approximation, but it gives you a solid basis for decisions: find the vital few, act on them first and keep an eye on the rest. The better your data, the more useful the analysis.
To get accurate data on where your team’s hours go, start a free 30-day trial of actiTIME, or book a demo if you want a walkthrough.