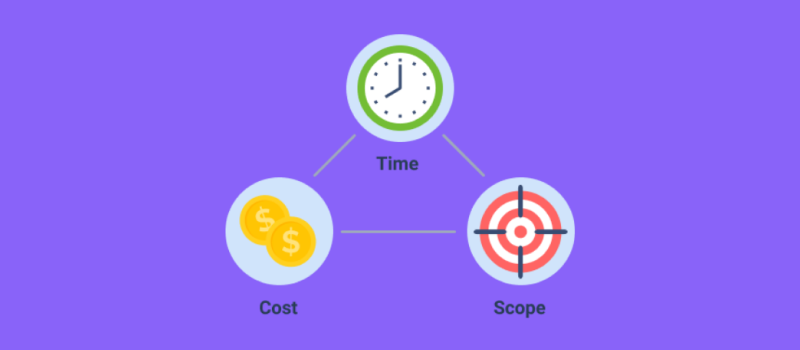



Project estimation is the work of predicting how much effort, time and money a project will take before it starts. Most guides stop at a list of project estimation techniques. The list matters, but it is not where estimates usually fail. They fail because the estimate is never compared with what the work actually took, so the same miss repeats on every project.
This guide covers the seven estimation methods teams actually use, how to choose between them, and a worked example that corrects a bottom-up estimate with the team’s own record of estimated vs. actual hours.
- What project estimation covers
- How accurate a project estimate can be
- 7 project estimation techniques
- Top-down vs. bottom-up estimating
- How to choose an estimation method
- Worked example: correcting an estimate with your own history
- The project estimation process in five steps
- Where project estimates go wrong
- Estimates vs. actuals in actiTIME
- FAQ
What project estimation covers
Estimation in project management produces four numbers, and each one depends on the one before it:
- Scope: what will be delivered, and what will not. Everything else is estimated against this list, usually broken down into a work breakdown structure.
- Effort: how many person hours the scope needs. This is the number the estimation methods below produce.
- Duration: how many calendar weeks the effort takes, given how many hours people can actually give the project.
- Cost: effort multiplied by what each hour costs, plus anything you buy.
Keep effort and duration apart. A task that needs 40 hours of work does not take one week if the person doing it spends half of each day on another project. Cost needs its own methods and its own accuracy ranges, which our guide to project cost estimation techniques covers in detail. This article stays with effort and duration, where most estimates go wrong first.
How accurate a project estimate can be
An estimate can only be as precise as the project is defined. Steve McConnell’s Cone of Uncertainty, drawn from software projects, puts estimates made at the initial concept stage anywhere from 0.25x to 4x the final result, a 16 fold spread. McConnell also notes that the cone narrows only as you make decisions that remove variability. Time passing does not narrow it.
Two practical rules follow. First, give early estimates as a range, not a single number. Second, re-estimate at each point where the scope gets firmer: after discovery, after design, at each milestone. Engineering and construction use formal estimate classes with published accuracy ranges; the cost estimation guide linked above sets them out.
7 project estimation techniques
These seven project estimation techniques answer the same question, how much work is this, from different starting points. The hours in the examples are illustrative.
1. Expert judgment
Someone who has done this kind of work before gives the estimate. A senior developer says an API integration will take about 30 hours because the last three took 25 to 35.
Best for: new kinds of work with no data, and as a sanity check on any other method. Watch out for: the number lives in one person’s head. Ask experts to list the steps behind their figure, so you can see what it includes and what it leaves out.
2. Analogous estimating
You take the actual effort of a similar finished project and adjust it for known differences. If the last client portal took 480 hours and the new one has about 25% more screens, the analogous estimate is 600 hours.
Best for: early estimates and sales conversations, when you know the rough shape of the work and little else. Watch out for: the reference project’s recorded hours. If people did not log all their time on it, every estimate built on it starts low.
3. Parametric estimating
You find a unit that drives the effort, measure its historical hours per unit and multiply. If a landing page takes 12 hours on average and the project needs 14 of them, plus 20 hours of setup, the parametric estimate is 14 x 12 + 20 = 188 hours.
Best for: repeatable work: pages, reports, training sessions, installations, translated documents. Watch out for: a unit rate measured on one project. Average it across several, and check that the unit really drives the effort on the new project.
4. Top-down estimating
You start from a total, often a sponsor’s budget, a fixed deadline or an analogous figure, and split it across phases using historical shares. If a 600 hour project usually spends 10% on discovery, 25% on design, 45% on build and 20% on testing, the phases get 60, 150, 270 and 120 hours.
Best for: checking whether a fixed budget or deadline is realistic, and setting phase targets early. Watch out for: treating the split as an estimate. Top down estimating tells you what each phase may spend, not what it will need.
5. Bottom-up estimating
You break the scope into tasks, estimate each one, and add them up. The people who will do the work estimate their own tasks, so every line can be questioned.
Best for: approved scope, fixed price bids and anything you will be held to. Watch out for: the sum of many small optimistic numbers. Each task estimate tends to describe the case where nothing goes wrong, and forgotten work such as reviews, handoffs and project management itself never makes it onto the list. The worked example below shows how to correct for that.
6. Three-point estimating
For an uncertain task you record an optimistic (O), most likely (M) and pessimistic (P) figure. The PERT formula weights the most likely case: E = (O + 4M + P) / 6. For a task at 30, 40 and 80 hours, that gives (30 + 160 + 80) / 6 = 45 hours, with a standard deviation of (P − O) / 6, or about 8 hours.
Some guides use the simple triangular average, (O + M + P) / 3, which gives 50 hours for the same task. Both are legitimate. The triangular average gives more weight to the extremes, so it is the more cautious choice when your pessimistic figures tend to come true.
Best for: the handful of tasks where the risk sits. Watch out for: pessimistic figures that are barely worse than the most likely one. A pessimistic number should describe a bad but plausible outcome.
7. Group estimation (Wideband Delphi and planning poker)
Several people estimate the same items independently, compare their numbers, discuss the outliers and estimate again. The approach comes from the Delphi method, which RAND developed in the 1950s, and agile teams use a fast version of it as planning poker with relative units instead of hours.
Best for: work where knowledge is spread across a team, and for exposing hidden assumptions. When two people are 3x apart, one of them knows something the other does not. Watch out for: the loudest voice anchoring the room, which is why the first round must be private. For relative sizing, see our guide to story point estimation.
Top-down vs. bottom-up estimating
Top down estimating and bottom up estimating are the most common pair of estimating methodologies, and they work best together. The top-down figure tells you what the project can afford; the bottom-up figure tells you what it needs. The gap between them is where the conversation with the sponsor starts.
| Question | Top-down | Bottom-up |
|---|---|---|
| Starts from | A total: budget, deadline or a similar project | A list of tasks |
| Who estimates | Project manager or sponsor | The people who will do each task |
| Time to produce | Hours | Days, because the work has to be broken down first |
| When it fits | Idea stage, go or no go decisions, fixed budgets | Approved scope, bids, task assignment |
| Typical error | Misses work the reference project did not have | Adds up optimistic task figures and forgets overhead work |
| Best paired with | A quick bottom-up of the riskiest phase | Your historical ratio of actual to estimated hours |
How to choose an estimation method
Pick the method by what you know right now, not by what sounds most rigorous. A bottom-up estimate built on a vague scope is precise about the wrong thing. The table gives a lead method for common situations and a second method to check it against. When two independent estimation methods land close to each other, you have some evidence the estimate is sound; when they are far apart, the gap usually points to a scope assumption one of them got wrong.
| Your situation | Lead with | Check with |
|---|---|---|
| First conversation, one similar past project | Analogous | Expert judgment |
| Sponsor has already fixed the budget or deadline | Top-down | Bottom-up of the riskiest phase |
| Work repeats in countable units | Parametric | Analogous |
| Scope approved and broken into tasks | Bottom-up | Historical ratio of actual to estimated hours |
| A few tasks carry most of the risk | Three-point on those tasks | Expert judgment |
| New kind of work, no history at all | Group estimation | Three-point ranges, re-estimated after the first milestone |
| Agile backlog with a stable team | Story points and velocity | Hours tracked per sprint |
Worked example: correcting an estimate with your own history
The most useful number in project estimation is one most teams never calculate: how far their estimates usually miss. Bent Flyvbjerg’s reference class forecasting (Project Management Journal, 2006) bases a forecast on the actual results of comparable projects instead of on the task list for this one, which sidesteps the optimism that every task list carries. A team that tracks time against estimated tasks can do a small version of this with its own data.
Here is how it works for a small agency estimating a website build. All figures are illustrative.
Inputs. Four recent projects of the same kind, with the hours estimated at kickoff and the hours actually tracked: 400 vs. 488, 260 vs. 299, 520 vs. 676, and 340 vs. 391. The new project’s bottom-up estimate is 450 hours. Three people will work on it, each with a 40 hour week, but each can give it only 60% of their time. Their blended cost rate is $55 per hour.
Read straight off the task list, this is a project of under four weeks. The team’s own history says almost eight, and about $5,400 more in labor. The 3.8 weeks assumed that everyone works on nothing else and that this estimate will be the first one in four to come in on target. Neither assumption has held before.
Sensitivity. Each 0.1 change in the ratio moves the estimate by 45 hours, about $2,475 and 0.6 weeks. Availability matters even more: if people can give the project 50% of their time instead of 60%, the same 549 hours stretch from 7.6 to 9.2 weeks. That is why the availability figure deserves as much scrutiny as the task estimates.
Two refinements make the ratio sharper. Calculate it by type of work, because design may run close to estimate while testing runs 50% over. And recalculate it after every project, because the ratio of a team that has started tracking honestly will drift as estimates improve.
The project estimation process in five steps
Put the methods together and project estimation becomes a short sequence you can repeat on every project:
- Write down the scope and the assumptions. List deliverables, what is out of scope and what you are assuming about the client, the tools and the team. Unwritten assumptions are where most misses start.
- Estimate effort with the method that fits what you know. Analogous or top-down early, bottom-up once tasks exist, three-point on the risky few.
- Correct it with history. Apply your ratio of actual to estimated hours from similar past work, and state the result as a range.
- Turn effort into duration and cost. Divide by the hours people can actually give the project, then multiply by cost rates.
- Track actuals against the estimate from the first week. Re-estimate the remaining work at each milestone and record the final numbers, because they become the history for step 3 next time.
For a deeper walkthrough of the time side, including capacity checks and running estimation sessions as a team, see our seven steps to accurate project time estimation and the broader guide to time estimation in project management. If you need a starting structure for step 1, download our work breakdown structure template below.
Where project estimates go wrong
Most estimation failures have little to do with which technique was chosen. These are the ones that repeat:
- Effort treated as duration. 120 hours of work is not three weeks for three people unless all three do nothing else.
- Estimating from memory. People remember past projects as shorter than they were, which is one reason the planning fallacy is so hard to shake. Without recorded actuals, analogous and parametric estimates inherit the same bias.
- Estimates that are never compared with actuals. If nobody looks at the variance, nobody learns which kinds of work run over, and the next estimate repeats the miss.
- One person estimating for everyone. The person doing the work sees steps the manager does not.
- The estimate becomes the deadline. An estimate is a forecast with a range; a commitment is a business decision about how much risk to accept. Present the range and let the sponsor choose where in it to commit.
- Anchoring on a number someone already said. Once a client has mentioned a budget or a manager has said “about a month”, estimates drift toward it. Estimate first, then compare.
- Forgotten work. Meetings, reviews, rework, deployment, client feedback rounds and project management rarely appear on the task list but always appear in the timesheet.
Some uncertainty cannot be estimated away at all, such as unplanned work that arrives mid project. Our article on project estimation uncertainty covers where it comes from, and software teams will find stack specific advice in our guide to estimating software development cost.


Estimates vs. actuals in actiTIME
The worked example depends on one thing: estimates and actual hours recorded against the same tasks. That is how actiTIME is built. Work is organized as customers, projects and tasks, and people log their hours against tasks in a weekly timesheet, a calendar view or the mobile app.
- Task estimates: set estimated hours on each task and edit them when the scope changes. Progress against the estimate shows on the task card and in the timesheet, and you can be notified when a task goes over.
- Estimated vs. Actual Time Report: shows the variance by task, project, customer or person, which is where the ratio in the worked example comes from and where you see which kinds of work run over.
- Time and cost budgets: set on a customer, project or task, with a progress bar that turns red once the budget is exceeded.
- Cost of Work Report: turns tracked hours into labor cost using each person’s cost rate, so the cost side of the estimate can be checked the same way.
Over a few projects, those reports become your reference class: real hours per type of work, and a measured record of how far your estimates usually miss.
Pricing: free for up to 3 users; paid options from $5 per user per month. Task estimates and budgets are part of the paid version and are included in the 30 day trial. See actiTIME pricing.
FAQ
Which project estimation technique is the most accurate?
Bottom-up estimating is usually the most accurate single method, because every task is estimated by the person who will do it. It is only as good as the scope behind it, though, and it shares the optimism of every task list. The most accurate approach in practice is a bottom-up estimate corrected by your own historical ratio of actual to estimated hours and checked against an analogous figure.
What tools are used for project estimation?
Most teams build estimates in a spreadsheet or a work breakdown structure template, then move the task estimates into a project or time tracking tool. The tool that improves estimates over time is the one that records actual hours against the same tasks, because it produces the history that analogous, parametric and calibrated estimates need. Dedicated estimating software is common in construction and engineering, where estimates rely on unit cost databases.
How do you estimate a project with no historical data?
Use expert judgment and group estimation, and give every risky task a three-point range rather than a single figure. Present the result as a range, agree to re-estimate after the first milestone, and start tracking actual hours against the estimated tasks from day one. After one project you have a rough ratio to work with, and after three or four similar projects it is reliable enough to quote from.
Build your next estimate on real hours
Every estimation method gets better with the same input: a record of what similar work actually took. actiTIME keeps task estimates and tracked hours side by side, so each finished project tells you how far to adjust the next one.
Start a free trial of actiTIME with full features for 30 days. After the trial, teams of up to 3 users can keep using it for free.