



Ask most people why their company tracks time and you’ll get one of three answers: it’s proof that work happened, it’s how payroll gets calculated, or it’s how clients get billed. All three are true. None of them are why I think time tracking actually matters.
Every one of those uses looks backward. They confirm what already happened. But the same data, read differently, is one of the better forecasting tools a project manager has sitting around unused. Every timesheet entry is a data point about how your team really works, not how you assumed they’d work when you wrote the plan. The more of that data you have, the sharper your next estimate gets, and the fewer surprises show up in the next budget review.
Watching how people actually use actiTIME, the project managers who get the most out of it aren’t the ones checking whether hours got logged. They’re the ones who pull up old projects before scoping new ones. Here’s what they’re looking at.
Estimates vs. actuals tell you where your estimating breaks down
Every task in actiTIME can carry an estimate, and the Estimated vs. Actual Time Report lines that estimate up against what actually got logged. One project’s variance report just tells you whether you were close that time. Ten or twenty projects’ worth tells you something more useful: where the estimating process itself keeps failing.
Maybe QA tasks run over almost every time, by roughly the same margin. Maybe one team pads their numbers and another consistently lowballs the same kind of work. Maybe design estimates hold up fine but development estimates never do. A single retro won’t surface any of that. It only shows up once you start treating estimate accuracy as something you track over time instead of a box you check at project close.
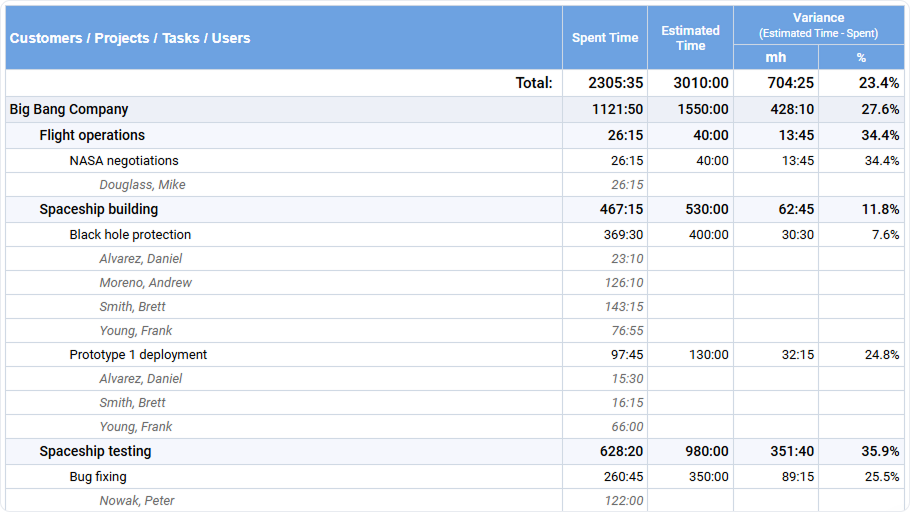
Before scoping the next similar project, pull the variance history from the last few. If a task type has run over every time, plan for that instead of hoping this one goes differently.
Team performance data replaces assumptions with a record
The Staff Performance Report, and the Time-Track Report grouped by project, customer, date, user, or type of work, show what each person actually logged. Not what the org chart implies they’re capable of.
Most staffing calls get made on assumption: this person is senior, so they must be fast; this kind of task usually takes a generalist two days. Historical time data swaps the guess for a record. If someone has consistently gotten through a certain type of work faster than others, or a certain type of work has consistently taken longer regardless of who’s on it, that’s worth knowing before you build the next plan, not after you’ve missed the deadline it caused.
This has nothing to do with ranking people against each other. It’s closer to what an experienced estimator already does in their head after enough years on the job, except now the data remembers instead of one person’s gut feeling about “how these things usually go.”
Leave time shows the capacity you actually have
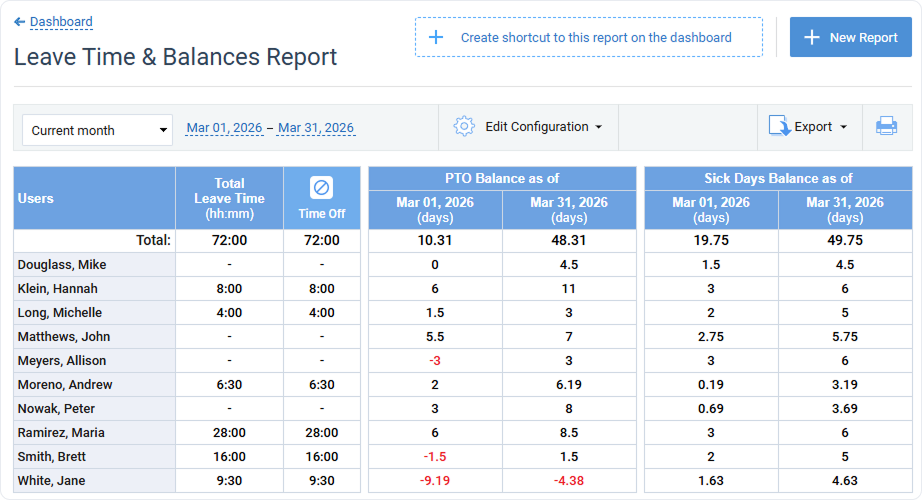
A resourcing plan built on headcount alone is built on a number that’s rarely true. actiTIME’s Leave Time and Balances Report shows who took leave, when, and what PTO balances look like ahead, and location data shows how work is split across office, remote, or other settings.
Ignore that and capacity planning goes wrong in a predictable way: it assumes everyone is available full time, all the time. Real teams take vacation, use sick days, and already have leave booked for the exact quarter you’re trying to staff. Check the leave patterns before allocating people to a new project, and the plan accounts for the hours someone can realistically give rather than the hours their contract says they owe.
Budgets show whether your past projects actually held the line
actiTIME tracks three separate budget types per customer, project, or task: cost budget (staff expense), billing budget (billable amount), and time budget (hours allocated versus spent). Each has a progress bar that turns red once a project runs over.
One red bar just tells you that one project ran hot. A portfolio’s worth of red bars tells you whether a certain kind of engagement is chronically underbudgeted. If projects of a certain size, client type, or scope keep blowing through their time budget by roughly the same margin, that’s worth pricing into the next proposal. It shouldn’t still be a surprise in the retro after the fifth time it’s happened.
More history makes better forecasts
Each of these four data points is thin on its own. One project’s estimate variance is noise. Ten projects’ worth is a pattern you can actually plan around, and the same is true for performance data, leave, and budgets.
Most companies already have this sitting in their time tracking tool. They’re just using it to answer “did this happen,” when the more useful question is what it tells you about what happens next. Time tracking that only looks backward is doing half its job. The other half, the part that actually makes you a better planner, is asking what the last ten projects can tell you about the eleventh.
You don’t need new data to start, either, just time you’ve already tracked. If you’ve logged even a handful of past projects, these patterns are probably already sitting in your reports, you just haven’t gone looking for them yet. actiTIME’s free trial is fully featured for 30 days, so you can pull your own estimate variance and cost of work numbers before committing to anything.