
In today’s ever-changing business landscape, it’s essential to keep a close eye on how your resources are being utilized. From labor to physical assets, managing what you have and making it work for you is critical to staying competitive.
But how can you measure and analyze this without getting bogged down in endless data?
Enter key resource utilization metrics.
By monitoring metrics like utilization variance and on-time completion rate, you can pinpoint bottlenecks, cut down on waste, and optimize your operations. These metrics offer an undeniable advantage when it comes to staying ahead of the game and achieving business success.
Let’s take a closer look at the 7 must-know resource utilization metrics and explore how they help to promote performance efficiency and save you a lot of money along the way.
What Is Resource Utilization in Project Management?
Resource utilization is the holy grail of efficiency measurement.
It shows how effectively you’re using your workforce, equipment, money, and materials to get the job done. Figuratively speaking, it’s a way of gauging how well you’re squeezing every last drop of performance out of your resources to achieve project success.
As an essential performance metric, resource utilization helps to evaluate a variety of factors that contribute to the overall effectiveness of your project. It lets you understand whether:
- You have the right people working on the right tasks, and that they’re not getting bogged down with non-essential work.
- Your equipment is being used to maximum capacity, without any downtime or delays. You keep your budget in check and allocate funds in a way that ensures your project stays on track.
- You use project materials strategically so that every penny you spend is put to good use.
Knowing all that, you will be able to find the right strategies and tools to help you stay organized, react to any problems proactively, and continue to move in the right direction while minimizing unnecessary waste and maximizing your revenues.

Resource Utilization vs. Resource Allocation
Resource utilization and resource allocation are two crucial concepts in project management. However, they slightly differ in their approach and objectives.
While resource utilization refers to the measure of how effectively resources are being used, resource allocation is the practice of assigning those resources to the right tasks at the right time. It involves careful planning and prioritization to guarantee that resources are distributed in the best possible way to achieve project goals.
A good resource allocation strategy requires a thorough understanding of project requirements, timelines, and resource capacity to ensure steady and high-quality performance without any waste or shortages.
Think of it as a game of Tetris in the world of project management:
You have a limited set of resources, and you need to figure out how to make them all fit together just right to complete your project on budget and on schedule. It’s like trying to fit the long skinny block into the perfect spot to avoid any empty spaces – you want to fit everything together perfectly so you can maximize your score, or in this case, your project’s success.
That’s what resource allocation is about.
7 Essential Resource Utilization Metrics
1. Resource utilization rate
This little gem of a metric helps to understand just how optimized your resources are. Essentially, it’s a measure of how many resources are being used, compared to how much is available. And it tells if you’re making the most of what you’ve got.
Are you using your time, money, and materials efficiently? Or are you wasting precious resources on tasks and projects that won’t yield significant returns? You need to calculate your resource utilization ratio to pinpoint inefficiencies and areas for improvement.
How to determine your resource utilization rate:
When it comes to factoring in labor resources, calculate the total hours worked by all employees within a given period and divide them by the total number of workable hours for that period.
For instance, if you spent 100 hours working on a project and had 200 hours of available time, your resource utilization ratio would be 50%, which isn’t ideal.
You need to strive for a 100% match between the total time or effort spent on a task and the total available time or effort – such a utilization rate will be the true indicator of efficiency.
Pro tip:
Calculating your resource utilization rate can quickly turn into a guessing game without a trusty time tracking tool. Therefore, we recommend you apply a solution like actiTIME to accurately record every minute spent on work and use the collected data to make evidence-based resource allocation decisions.
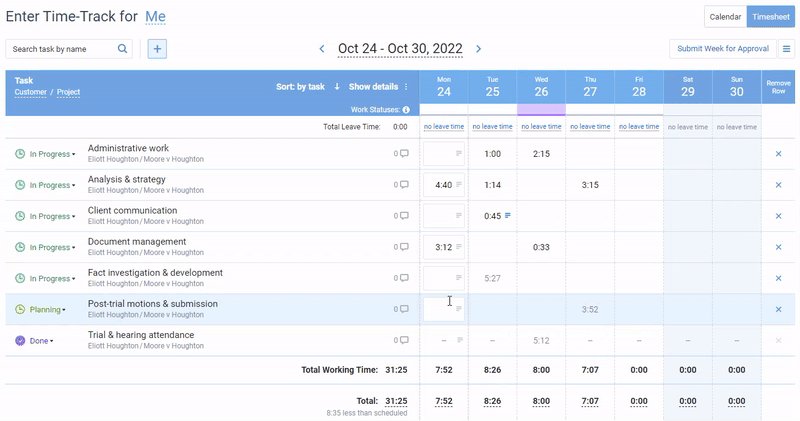
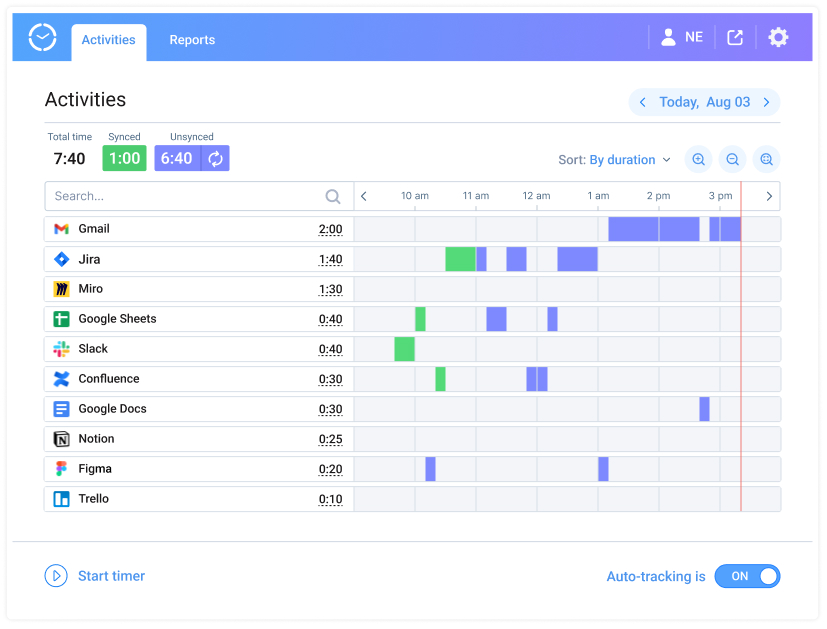
actiTIME makes it easy to track the hours each team member spends on the project. This can be done manually (i.e., using a timesheet or a calendar interface) or with the help of a fully automated browser extension – Time Management Assistant.
Once enough time tracking data is collected, you may run one of many actiTIME reports to retrieve factual data needed to calculate your resource utilization rate.
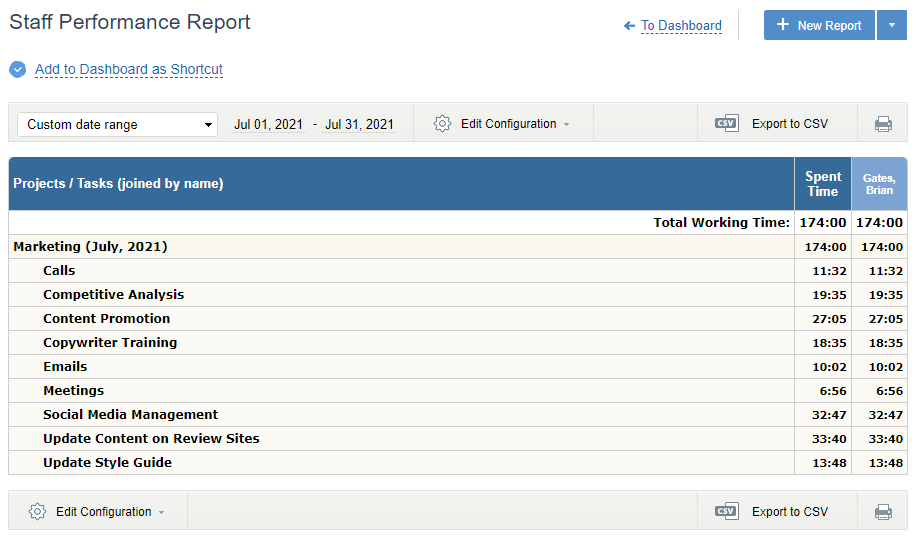
For instance, Staff Performance Report will provide you with a summary of the overall time invested in work for any period and for any team member. And in case you need to take a closer look at the difference between the scheduled employee time and the actual time worked, you may run the Time Balance & Overtime Report which points at any overspending of resources.
2. Billable time utilization rate
The billable time utilization rate measures the amount of time your business spends on billable work compared to the total amount of time you spend on everything else (like those endless meetings and coffee runs).
No matter which industry you work in and what kind of services you prove, your billable time utilization rate is like your GPA – the higher, the better.
How to determine your billable time utilization rate:
Step 1: Identify the total number of hours in a given period (e.g., a week, month, or year). This includes both billable and non-billable hours, such as administrative tasks, client meetings, or team brainstorming sessions.
Step 2: Figure out how many of those hours were spent on billable work, i.e., any work that directly generates revenue for your business, such as client consultations, project management, or creative work.
Step 3: Divide your billable hours by your total hours, and then multiply the result by 100 to get a percentage.
For example, if you worked a total of 40 hours in a given week, and 30 of those hours were spent on billable work, your utilization rate would be 75% (30/40 x 100). This tells you that you are using 75% of your time to generate revenue for your business, which isn’t that bad since non-billable work is impossible to avoid entirely.
Pro tip:
Want to boost your billable time utilization rate?
Start by tracking your time carefully and identifying any non-billable tasks that are eating up your valuable working hours. From there, you can optimize your workflow, allocate workloads more wisely, or adjust your pricing structure to ensure that you are maximizing your billable time and making the most of your business’s potential.
That’s where actiTIME can help as well.
With its functionality for billable time tracking, you can easily identify which non-billable tasks are taking up too much of your effort and get a clear breakdown of your billable hours by each project or client, to see which clients or projects are most profitable for your business. Armed with this information, you can make informed business decisions regarding which clients to focus on, which projects to pursue, or even how to change your pricing structure for the better.

3. Resource capacity rate
This handy metric plays a vital role in resource allocation as calculates how much resource an organization needs to keep things running smoothly. In other words, it helps to figure out how many people, tools, or equipment you need at your disposal so you don’t run out of steam mid-project.
How to determine your resource capacity rate:
Step 1: Identify all the resources required for your project and then estimate them. This may include estimating the number of hours a designer will need to complete a specific task and the amount of time required by a front-end developer to implement the design.
Step 2: Assess resource availability.
For personnel, this means determining the number of hours they can devote to the project per day, week, or month, taking into account any holidays, vacations, or sick days. For equipment, this means assessing its lifespan, capacity, and maintenance requirements. Finally, for materials, it means identifying their availability, lead times, and order quantities.
Step 3: Divide the number of available resources by the estimated hours.
For instance, if your employees can work merely 50 hours per period while you need them to work 100 hours, your resource capacity rate will be 0,5. Such a rate indicates resource shortage and means that you need to readjust your plan – re-prioritize tasks, outsource them, change deadlines, etc.
Ideally, you need to strive for the rate of 1 as it signifies the perfect match between your estimates and resource availability.
Pro tip:
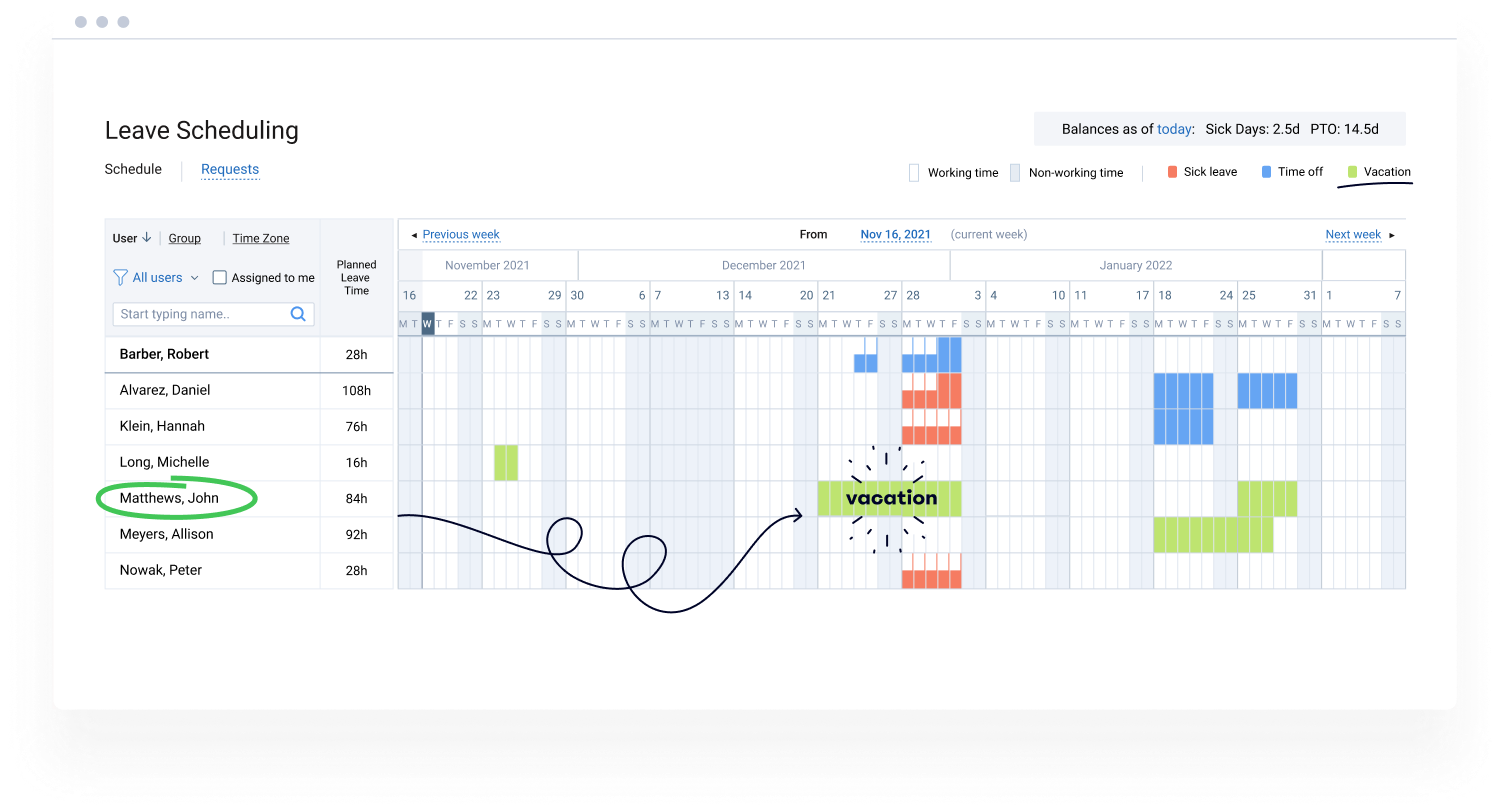
As you can see, when calculating resource capacity, you can’t get away without the data on employee availability. You need a clear picture of scheduled staff absences to plan out resources and avoid any resource shortages and consequent delays.
Luckily, with the help of leave management software like actiPLANS, you may get all the data you need and calculate resource capacity with ease and precision. It allows employees to schedule any kind of time off in advance and includes a plethora of valuable reports that provide comprehensive staff absence data for better project planning.
On top of that, actiPLANS can be seamlessly integrated with actiTIME to enable you to track both planned and unplanned employee absences with an incomparable convenience.
Check it out either as a stand-alone piece or in combination with actiTIME during a free 30-day trial.
4. Resource allocation efficiency
In economic terms, in order to achieve optimal efficiency, the price of your goods or services should be equal to (or higher than) the marginal cost associated with producing or providing services to each additional consumer.
In other words, the cost of producing one more unit of a product or providing one more service should be equal to (or lower than) the revenue generated by selling that unit or service. This ensures that resources are being used efficiently, as the cost of production or provision is being offset by the revenue generated and your business remains profitable.
To identify your resource allocation efficiency rate in a simpler way, you may merely compare your input-output proportions, i.e., evaluate the resources you put into your business against the output or the result you get from it.
How to determine your resource allocation efficiency rate:
Step 1: Identify all the resources that you have invested in your business. This could include money, time, or any other assets that you have used to grow your business.
Step 2: Look at the output or result you have achieved because of these resources. This could include sales revenue, customer satisfaction, or any other measurable outcome. By comparing these two factors, you can get a clear idea of your resource allocation efficiency rate.
Let’s take an example to illustrate this.
Suppose you have invested $10,000 in a marketing campaign, and you received $20,000 in sales revenue as a result of that campaign. In this case, your resource allocation efficiency rate would be 1:2, which means you received twice the output than what you invested.
It’s vital to keep your output levels at least a bit higher than the levels of your input – otherwise, it will be hard for your business to stay afloat, not to mention, continue to grow and thrive.
Pro tip:
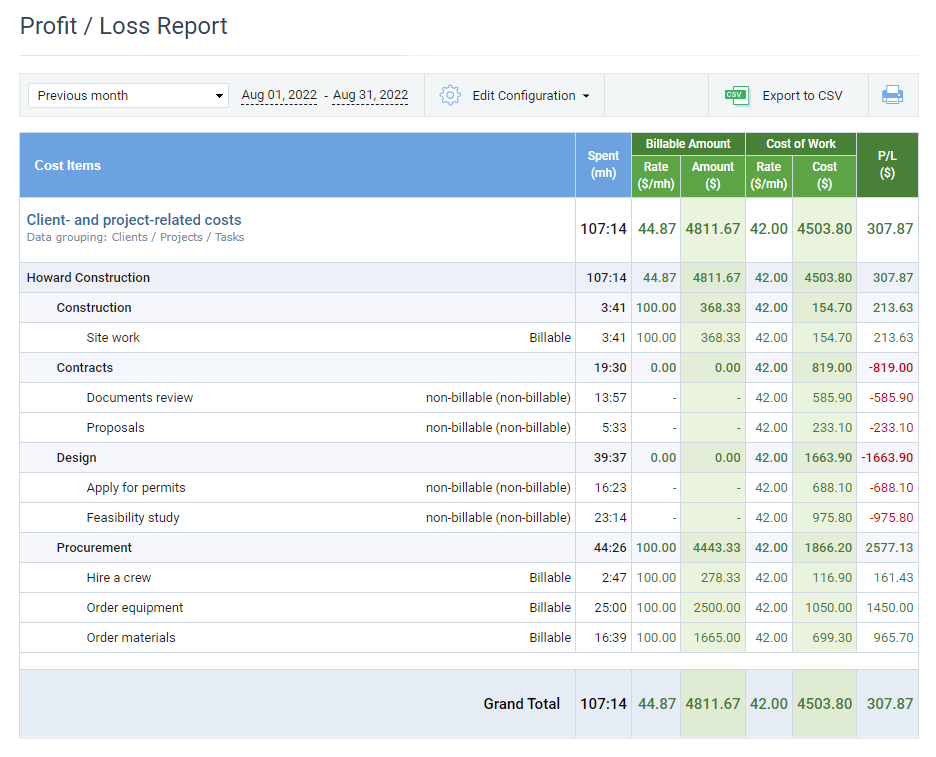
With actiTIME’s Profit / Loss Report evaluating your resource allocation efficiency is as easy as ABC. It clearly shows how profitable your projects are and where you might be able to trim some excess expenses.
With insightful data in hand, you can dig into your efficiency problems, find effective ways to optimize your performance, and ultimately earn more money. So, why not give it a try?
5. On-time completion rate
On-time completion rate is the total number of tasks completed on or before their due date, divided by the total number of tasks attempted. However, what makes this seemingly elementary formula truly special is the depth of insights it can provide into a business’s operations and performance.
For instance, a high on-time completion rate could indicate a team functioning like a well-oiled machine, where tasks are executed with precision and consistency. On the other hand, a low on-time completion rate could signal a need for process optimization or resource reallocation.
How to determine your on-time completion rate:
Step 1: Gather data on the total number of tasks attempted, the number of tasks completed on or before their due date, and the corresponding deadlines.
Step 2: Plug the collected numbers into the above formula.
Suppose we have a project consisting of 50 tasks, and each task has a scheduled completion date. At the end of the scheduled timeframe, 40 tasks were completed within their respective deadlines, and 10 tasks were delayed. The on-time completion rate in this scenario would be (40/50) x 100, which is 80%.
This means that 80% of the tasks were completed within their respective deadlines, and the remaining 20% were delayed for some reason – and your goal here is to identify why.
Pro tip:
With actiTIME, the data on the tasks you’ve been working on is always at your fingertips. It can be accessed via built-in detailed reports or exported for further processing in third-party tools.
On top of that, actiTIME features a visual deadline and estimate tracker that helps to keep everyone aware of the ongoing progress status and promotes the on-time completion of tasks.
6. Utilization variance
This metric helps to identify the discrepancies between the planned and actual utilization of resources, allowing project managers to pinpoint any underlying issues and make timely decisions to optimize resource allocation.
How to determine your resource utilization variance:
Step 1: Gather your initial task estimates and the data on the actual utilization of resources (e.g., the number of hours worked).
Step 2: Use the above formula for calculating resource utilization variance.
For example, let’s say that a project budgeted 300 hours of work for a particular resource over a week. However, the actual utilization for that resource turned out to be 250 hours. Using the formula above, we can calculate the resource utilization variance as follows:
(250 – 300) ÷ 300 = -0.1667 or -16.67%
This means that the actual utilization was 16.67% less than the planned utilization, indicating that either there was an error in your initial estimates or you underwent an unexpected boost in performance efficiency.
Pro tip:
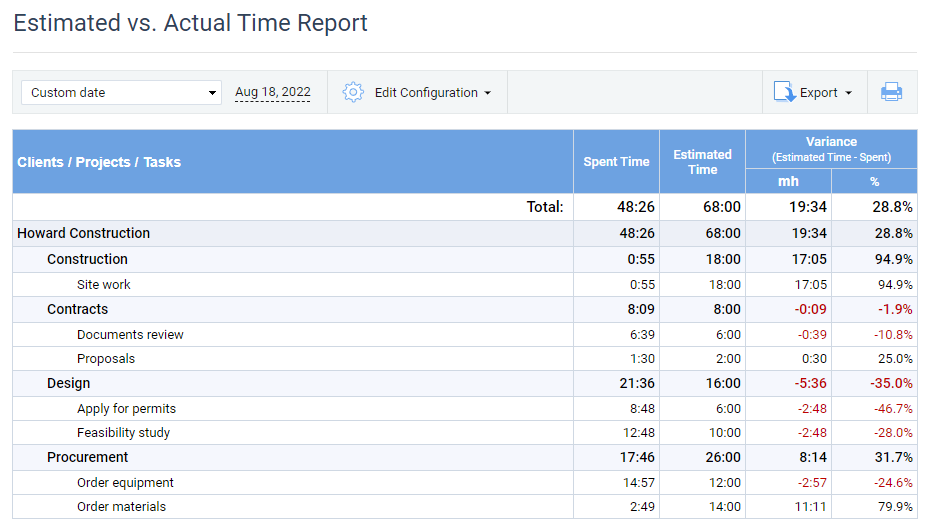
actiTIME provides concrete time tracking data for accurate resource estimation and allocation – so, no more relying on vague assumptions or gut instincts!
Besides, actiTIME’s Estimated vs. Actual Time Report gives you a quick but in-depth insight into resource utilization variance. This means you can easily compare what was estimated with what actually happened during a project without wasting a single moment on manual calculations – now, that’s what we call efficient!
7. Revenue per employee
Revenue per employee is a crucial metric for evaluating a company’s performance and potential. By dividing total revenue by the number of employees, we can determine how much money each employee generates for the company on average, which is essential for determining your company’s efficiency and productivity, as well as identifying any potential areas for improvement, e.g., staffing shortages, low employee engagement, etc.
How to determine your revenue per employee:
Revenue per employee is calculated by dividing a company’s total revenue by the number of employees.
Simple, right?
But let’s dive into an example of how to calculate this metric:
Suppose that your company generated $10 million in revenue and employed 50 people in a fiscal year. To calculate the revenue per employee, you can simply divide $10 million by 50 to get $200,000. This means that each employee generated $200,000 of revenue for the company on average.
Pro tip:
To simplify the above calculations, make use of actiTIME’s Billing Summary and Cost of Work Report. These features give you data on the total revenue earned by your company and show how much money you’ve spent on each team member’s wage for any period of choice.
Thanks to actiTIME, you can easily collect and consolidate data on each employee’s productivity, billable hours, and salary. From there, you can do your calculations and evaluate team performance as a whole or take a look at individual work results and think about what could be improved or maintained in terms of efficiency.
Conclusion
With the right metrics in place, there’s no limit to what you can achieve when it comes to unlocking peak performance. And each metric showcased here plays an important role – whether it be for better budget allocation or enhanced operational efficiency – they will only prove useful if implemented properly into a company’s operations.
That’s why actiTIME provides exactly the tool that businesses need in order to overcome resource-related challenges head-on.
Not only will it provide valuable insights but also help handle resources responsibly with its comprehensive project management features designed for the modern workplace.
So don’t wait any longer! Take your performance optimization efforts up a notch by introducing actiTIME into your operations today!