Six Sigma is a data-driven methodology that helps businesses identify and eliminate defects in their processes.
Originally developed in the manufacturing sector in the 1980s, it has quickly evolved into a versatile approach applied across various industries, from healthcare to finance and beyond. Its primary goal? To enhance efficiency and improve the quality of the final product.
In our laid-back guide, we’ll explore Six Sigma fundamentals and highlight the essential tools and techniques you need to implement it successfully, regardless of your niche. Jump in!
A Blast from the Past
It’s not every day that the background of a methodology helps us understand how it operates now, but with Six Sigma, that’s exactly the case.
The story begins at Motorola. Around 40 years ago, this business was facing serious quality and financial issues: they were producing thousands of cell phones and having a significant number of them malfunction.
An engineer named Bill Smith found out that by using statistical methods to analyze manufacturing practices, the company could change the situation.
This led to the birth of Six Sigma, a process that produces fewer than 3.4 defects per million opportunities, and that helped Motorola save billions and restore their reputation.
Other companies didn’t stay away, and soon General Electric jumped on the bandwagon. Under the leadership of Jack Welch GE made Six Sigma a core part of their business strategy, which led to massive improvements in efficiency and customer satisfaction.
Thus, managers recognized that achieving Six Sigma quality required not only technical expertise but also cultural change and leadership commitment, and started integrating Six Sigma principles into broader frameworks.
By the 2000s, the meaning of the “Six Sigma” term expanded beyond statistics, and it began to symbolize both operational excellence and organizational agility.
Key aspects of the modern Six Sigma:
- Understanding customer needs and expectations.
- Using advanced analytics and big data to drive insights and inform strategic decisions.
- A cultural shift where employees at all levels are empowered to contribute to process improvements and share ownership of quality initiatives.
- Sustainable practices that consider environmental impact and social responsibility, aligning with global trends toward corporate social responsibility.
- Agile methodologies that enable quick responses to market changes and customer demands.

The Six Sigma Quickstart Toolkit
Six Sigma operates through a structured framework known as DMAIC, which stands for Define, Measure, Analyze, Improve, and Control.
To facilitate each phase of the DMAIC process, Six Sigma practitioners utilize a variety of tools and techniques.
Define
In this initial phase, teams identify problems or opportunities for improvement, establish clear project goals, and ensure their alignment with business objectives.
Key activities include:
- Identifying the problem: What is the issue that needs to be addressed?
- Setting objectives: What are the desired outcomes?
- Defining the scope: What are the boundaries of the project?
- Identifying stakeholders: Who is involved or affected by the process?
Tools to use:
SIPOC Diagram: Helps to map out Suppliers, Inputs, Process, Outputs, and Customers to provide a high-level overview of the process being analyzed.
Software recommendation: Venngage
This platform offers customizable high-level process templates specifically designed for SIPOC diagrams. You can add text, colors, shapes, icons, and other elements and then invite your entire team to work on the diagram together.
Project Charter: Delineates what the project entails and acts as a guiding framework for all the parties involved.
Software recommendation: actiTIME template
The template helps project stakeholders grasp what they are supposed to accomplish and when. It documents all project essential elements, such as objectives, scope, participants, and resources, ensuring that no critical aspect is overlooked.
. 

Voice of the Customer (VoC): Involves collecting direct feedback from customers through various methods, like surveys, interviews, and complaints and translating this qualitative data into quantifiable goals, so that the project remains focused on meeting both business goals and customer needs.
Software recommendation: CalabrioOne
Calabrio captures customer interactions across various channels and utilizes AI to automatically generate prioritized lists of the most common conversation topics and concerns, enabling rapid root cause analysis.
Measure
Here, teams collect data to understand current performance levels.
Key activities include:
- Identifying key metrics: What measurements will be used to assess performance?
- Accumulating information: What quantitative and qualitative data is related to the process?
- Establishing a baseline: What is the current state of the process compared against future improvements?
- Creating process maps: Visual representations of the process help identify areas for improvement.
Tools to use:
Control Charts: Help distinguish between normal variations inherent in processes and those caused by external factors.
Software recommendation: ASQ templates
The American Society for Quality (ASQ) offers a comprehensive suite of resources and tools designed to enhance quality management practices.
Their control chart templates are designed with user accessibility in mind and fit for both beginners and experienced practitioners.
You can select from various types of charts, including X-bar, R-charts, p-charts, and np-charts, depending on your specific data characteristics and process requirements.
Data Collection Plan: Outlines the specifics of data to be gathered, including how it will be collected, who will be responsible for the collection, and the frequency of data gathering.
Software recommendation: Minitab
Minitab is a software package that offers a wide array of statistical tools, including descriptive statistics, hypothesis testing, and regression analysis. These let your team outline clearly what information they need to derive meaningful insights that drive process improvements.
Gage RR (Repeatability and Reproducibility): Allows you to assess the reliability of the selected measurement systems. Evaluates whether different operators or instruments yield consistent results under identical conditions.
Software recommendation: Easygagerr
EasyGageRR is an innovative software solution that allows you to collect data with minimum effort. Its AI automatically recognizes various formats, saving your time on manual data preparation and providing clear, actionable guidance on what went wrong and how to fix it.
Analyze
This phase involves examining the collected data to identify root causes of defects or inefficiencies and uncover patterns and correlations that contribute to the problem.
Key activities include:
- Data analysis: Use statistical tools and techniques to analyze the data.
- Identifying root causes: Determine what factors are contributing to the problem.
- Verifying causes: Validate that the identified root causes are indeed responsible for the issues observed.
- Developing hypotheses: Formulate potential solutions based on the analysis.
Tools to use:
Fishbone Diagram (Ishikawa): Visually organizes potential causes of a problem into categories, making it easier to identify underlying issues.
Software recommendation: MindMeister
This online mind mapping software really makes it easy to visualize complex problems.
MindMeister’s drag-and-drop functionality allows you to quickly create and modify a fishbone diagram using various templates and customization features such as colors, icons, and images.
Once the diagram is ready, you can export it in PDF, PNG, and other formats, to share your vision with stakeholders.
The 5 Whys technique: Helps to drill down into the root cause of a problem by asking “why” repeatedly until you reach the fundamental issue.
Software recommendation: EasyRCA
EasyRCA carefully guides you through each “why” and ensures that you detect the true underlying causes of issues rather than jump to quick conclusions.
It has features for documenting your findings and generating reports, which will further come in handy when tracking issues, sharing insights with team members and providing evidence of problem-solving efforts in the future.
Pareto Chart: Visually represents the most significant factors contributing to a problem, based on the 80/20 principle. Lets you focus your efforts on addressing areas that will yield the greatest impact.
Software recommendation: Lucidchart
Lucidchart is a popular diagramming application that stands out for its straightforward interface: you can import data from various sources, including Excel spreadsheets and CSV files, and modify colors, labels, and data points in a few clicks.
Besides that, you can utilize the dynamic charts option, and your visualizations will automatically update when the underlying data changes.
Improve
Based on the insights gained during analysis, teams develop and implement solutions aimed at addressing the root causes of defects, such as redesigning processes, introducing new technologies, or training employees.
Key activities include:
- Generating solutions: Brainstorm potential improvements or changes to the process.
- Selecting best options: Evaluate and choose the most effective solutions based on feasibility and impact.
- Testing: Implement pilot tests or trials to see how well the selected solutions work.
- Managing changes: Extrapolate successful solutions to the whole organization and its processes.
Tools to use:
Brainstorming: Encourages team members to generate a wide range of ideas and uncover innovative approaches that may span various functions within the organization.
Software recommendation: Stormboard
Stormboard provides a dynamic visual workspace for brainstorming and prioritizing ideas using sticky notes, images, videos, and an interactive voting feature.
For beginners, it offers templates specifically designed to guide you through the brainstorming process (e.g. SWOT analysis or affinity diagrams) and ensure that discussions remain focused and productive.
Additionally, Stormboard integrates with many tools commonly used in Six Sigma projects, such as project management software and data analysis platforms, allowing you to easily transfer ideas and insights generated during brainstorming sessions into actionable plans and workflows.
FMEA (Failure Modes and Effects Analysis): Identifies potential failure points within a process and assesses them based on severity, likelihood of occurrence, and detectability.
Software recommendation: APIS
APIS-IQ is a comprehensive framework for conducting Failure Mode and Effects Analysis letting you reproduce potential failure scenarios, assess their impact, and prioritize them based on risk.
It applies various statistical methods to quantify risks, evaluate process performance, and generate detailed reports and action plans.
For organizations operating in regulated industries, APIS-IQ also helps ensure compliance with industry standards and regulations related to failure analysis and quality management.
Pilot Testing: Allows you to validate improvements in safe environments to minimize risk. Provides an opportunity for further refinement based on real-world feedback.
Software recommendation: testRigor
testRigor is an AI-powered tool used to create automated tests in plain English, without needing to write code. It is developed for quick testing of web, mobile, API, and desktop applications, but can also be utilized for testing manufacturing and other software.
Control
The final phase focuses on sustaining improvements over time. Teams establish control plans to monitor process performance and check whether the target gains are maintained and all deviations are promptly addressed.
Key activities include:
- Monitoring performance: Establish ongoing measurement systems to track key metrics.
- Standardizing processes: Document new procedures and best practices to ensure consistency.
- Training staff: Ensure that all team members are trained on new processes and tools.
- Continuous improvement: Encourage a culture of ongoing assessment and refinement of processes.
Tools to use:
Standard Work: Defines the optimal way to perform tasks in a consistent manner. Reduces variability across different individuals and shifts.
Software recommendation: Process.st
Process.st is a platform for creating and managing standard operating procedures (SOPs). It simplifies the documentation process so that employees at all levels can understand and follow standardized work processes without stress.
Process.st utilizes checklists to guide your staff through each step of the workflow and ensure that critical tasks are completed consistently and correctly.
The platform also provides version control features that allow teams to track changes made to standard work documents over time and offers analytics that provide insights into task completion rates and workflow efficiency.
Control Plan: Documents how the enhanced process will be monitored over time, specifying who is responsible for oversight and outlining actions to take if performance deviates from established standards.
Software recommendation: Babtec
Babtec is an extremely powerful software suite for creating, managing, and monitoring control plans.
It has real-time tracking capabilities and lets you check performance metrics at any moment and immediately spot deviations from established limits.
Additionally, all Babtec tools allow for extensive customization, which means you can create relevant and effective control plans for managing quality across diverse projects and operational contexts.
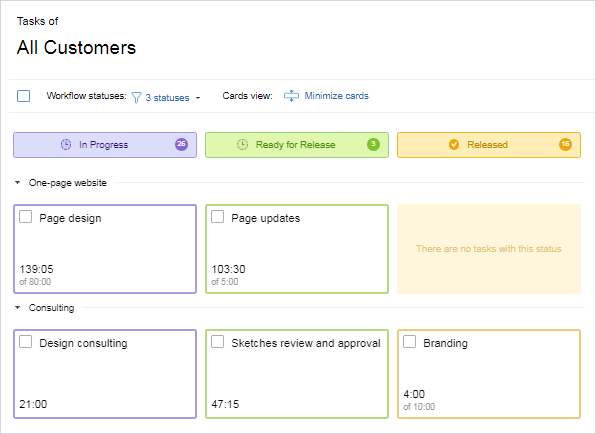
Visual Management: Enables quick identification of any deviations from expected performance levels through Kanban boards, checklists, or project progress reports.
Software recommendation: actiTIME
actiTIME is a comprehensive time and project tracking tool that allows you to monitor how much time is spent on various tasks and turn this data into charts and reports to identify inefficiencies and understand where resources are misallocated.
It also offers Kanban boards where you can visualize task statuses and deadlines, ensuring that all members are aligned with project goals and timelines.
Key features:
- Track time both online and offline through intuitive timesheets.
- Get a clear representation of work progress and employee productivity.
- Monitor project budgets to avoid overruns.
Conclusion
Six Sigma is a valuable methodology for teams aiming to enhance their processes and deliver better results. However, you should always keep in mind that it is more than just a set of tools, and that success requires commitment from all levels of management and ongoing training for team members.
As you apply the techniques from this post in real-world scenarios, you’ll gain confidence and deepen your understanding of Six Sigma principles. Embrace the journey of continuous improvement, and watch as your team achieves greater efficiency and customer satisfaction!