
A project can have a schedule and still finish late. Usually the schedule was a list of dates nobody tested against real effort, or nobody checked progress against it until the deadline was already gone. Project time management fixes both problems: it is the set of processes a project manager uses to define the work, put it in order, estimate how long each piece takes, build a realistic schedule, and then control that schedule with actual time data until the project closes.
This guide walks through the six processes of project time management in the order you use them, with the estimating and control formulas you need, a worked example for each, and a short section on doing it in a time tracker.
What is project time management?
Project time management is the part of project management that makes sure a project finishes on time. It covers defining the activities, sequencing them, estimating their durations, building the schedule, and controlling that schedule as work happens.
The term comes from the Project Management Institute’s PMBOK Guide, which listed Project Time Management as one of its knowledge areas until the Sixth Edition (2017) renamed it Project Schedule Management. The name changed, the job did not: the Sixth Edition still describes six processes, from planning schedule management to controlling the schedule. The newest edition, the PMBOK Guide Eighth Edition published in November 2025, organizes the same ground as a “Schedule” performance domain instead of a numbered knowledge area. Most teams and job ads still say project time management, so this guide uses that name.
It also helps to separate it from personal time management. Personal time management is about how one person plans a day. Project time management is about how a whole team’s work fits into a deadline, which means it deals with dependencies, estimates, and other people’s availability.
Why project time management matters
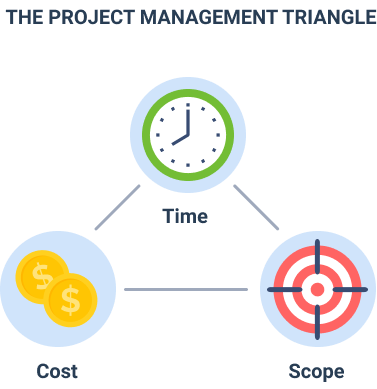
Time is one side of the triple constraint, together with scope and cost. Change one and at least one of the others moves. Fewer months means less scope you can realistically deliver, or a higher cost because you add people or overtime to keep quality where it was.
Time is also the one resource you cannot buy back. Peter Drucker made this point in The Effective Executive, writing that “there is no substitute for time.” Money can be raised and people can be hired, but a week lost in March is gone. That is why project managers plan time with the same care they give to the budget, and why they check it weekly rather than at the end.
The six processes of project time management
The six processes below follow the PMBOK Guide Sixth Edition list for schedule management. You run the first five while planning and the sixth for the rest of the project. On a small project some of them take ten minutes; on a large one each produces its own document.
| Process | Question it answers | Typical output |
|---|---|---|
| 1. Plan schedule management | How will we build, measure and change the schedule? | Schedule management plan |
| 2. Define activities | What exactly has to be done? | Activity list, milestones |
| 3. Sequence activities | In what order, and what depends on what? | Network diagram |
| 4. Estimate activity durations | How long will each activity take? | Duration estimates with ranges |
| 5. Develop schedule | When does each activity start and finish? | Schedule baseline, timeline or Gantt chart |
| 6. Control schedule | Are we on track, and what do we change if not? | Progress data, variance, change requests |
1. Plan schedule management
Before you set a single date, decide the rules. Which unit do you estimate in (hours, days, story points)? How often is progress reported, and by whom? How big does a slip have to be before it needs a decision from the sponsor? Which tool holds the schedule? Writing these answers down takes an hour and saves arguments later, because everyone measures progress the same way.
2. Define activities
Start from the scope and break it down. A work breakdown structure (WBS) splits the deliverables into smaller work packages, and each work package is then split into activities someone can actually do and finish. A practical test: if an activity cannot be estimated with reasonable confidence or assigned to one owner, break it down further. Mark milestones (zero duration events such as “client signs off design”) at this step too, because they become the checkpoints you report against.
3. Sequence activities
Next, link the activities. Most links are finish to start: testing cannot start until the build is finished. Some are start to start (documentation can start once development starts) or finish to finish (QA cannot finish before development finishes). Add lags where work has to wait, such as two days for concrete to cure or a week for client review. The result is a network diagram, and it is the input for finding the critical path later.
4. Estimate activity durations
Estimate after you know who will do the work and what they have available, because the same task takes a senior specialist and a new hire different amounts of time. The main estimation techniques are:
- Analogous estimating: use the actual duration of a similar past activity. Fast, and only as good as your records.
- Parametric estimating: multiply a known rate by the quantity, for example 3 hours per landing page times 12 pages.
- Three point estimating: ask for an optimistic (O), most likely (M) and pessimistic (P) duration and combine them.
- Bottom up estimating: estimate small activities and add them up to work packages and phases.
The most common three point formula is the PERT weighted average, (O + 4M + P) / 6, with (P − O) / 6 as a rough standard deviation. Here is a worked example for an activity estimated at 4, 6 and 14 days:
Notice that the expected value (7 days) is higher than the most likely value (6 days). That gap is the pessimistic tail pulling the estimate up, and that is the risk a single number would hide. The best long term fix for estimates is data: compare every estimate with the actual hours tracked and you will see which kinds of work your team underestimates. Our guide to time estimation in actiTIME shows how to set this up.
5. Develop the schedule
Now combine the sequence, the durations and people’s availability into dates. Three techniques do most of the work:
- Critical path method: find the longest chain of dependent activities. Its length is the shortest possible project duration, and any delay on it delays the finish date. Activities off the critical path have float, meaning they can slip a little without moving the end date.
- Resource leveling: if one person is booked on two critical activities at once, move one of them. This often extends the schedule, but a schedule that assumes someone works 16 hours a day is not real anyway. See our guide to resource management for leveling and capacity planning.
- Schedule compression: if the dates are too late, either crash (add people or overtime to critical activities, which costs money) or fast track (run activities in parallel that were planned in sequence, which adds risk and rework).
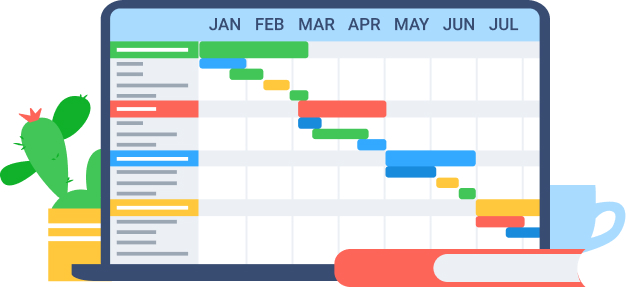
Show the result visually. A project timeline or Gantt chart makes overlaps and dependencies visible, which a plain task list with due dates does not. Once stakeholders agree, save this version as the schedule baseline; it is what you will measure against. For more ways to build the plan, see these project scheduling techniques.
6. Control the schedule
Control starts on the first day of work and runs until closure. It has three parts: collect actual progress, compare it with the baseline, and decide what to do about the gap. Progress data that people fill in from memory at the end of the month is too late and too vague, which is why most teams use time tracking at the task level.
Two numbers from earned value management tell you where the schedule stands. Schedule variance is SV = EV − PV, and the schedule performance index is SPI = EV / PV, where planned value (PV) is the budgeted value of work scheduled to date and earned value (EV) is the budgeted value of work actually completed. An example:
An SPI of 0.8 means the team is completing work at 80% of the planned rate. If you do not use earned value, a simpler check works for most teams: compare estimated hours with actual hours per task every week and look at which tasks on the critical path are behind.
When you find a gap, choose a response on purpose: change the sequence, add capacity, cut or defer scope, or move the date through a formal change. Then tell the team what changed and why. Finally, at the end of the project, review where time actually went compared with the plan. That review feeds the analogous estimates for your next project, which is how estimates get better over time.


What good project time management gives you
When the six processes run well, you see the effects in specific places:
- Earlier warnings. A slip shows up in week 3 as a variance on one task, not in week 12 as a missed launch.
- Fewer cost overruns, because on labor heavy projects late work is usually extra paid hours.
- Honest commitments to clients and sponsors, based on estimates you can explain.
- Less overtime and burnout, because overload is visible while there is still time to rebalance it.
- Better estimates on the next project, built from the actual hours of this one.
Why projects run late and what to do about it
Most schedule problems come from a short list of causes. Each has a matching fix inside the six processes:
| Cause | What it looks like | Fix |
|---|---|---|
| Single point estimates | Every task is estimated at its most likely duration, so nothing absorbs bad luck | Three point estimates and a visible buffer at the end of the critical path |
| Scope creep | Small requests get added without moving any dates | Route every change through schedule control and show its time cost |
| Hidden dependencies | A task waits on an approval or another team nobody listed | Sequence activities with the people who do the work, include external inputs |
| Overbooked people | The same specialist sits on three critical tasks in one week | Level resources before you publish dates; count leave and support work |
| Late progress data | Status is “90% done” for weeks | Track actual hours weekly and compare them with estimates per task |
Team communication matters here too. People need to know which tasks are on the critical path and what the current estimate is, otherwise they optimize their own work rather than the finish date. Our article on effective communication in the workplace covers the habits that help.
Project time management in agile teams
Agile teams manage time differently, but they still manage it. Instead of one detailed schedule built up front, they fix the time box (a sprint of one to four weeks) and let the scope inside it vary. Planning happens every sprint, estimates are often relative (for example story points), and the team’s measured velocity replaces the duration estimate as the basis for forecasting a release date.
The six processes map onto this rhythm. Defining and sequencing activities happens during backlog refinement, estimating and scheduling during sprint planning, and control during the daily standup and sprint review. Many organizations run a hybrid: a milestone schedule for the client or sponsor, and sprints inside each milestone for the delivery team.
How to manage project time in actiTIME
actiTIME covers the estimating and control side of project time management: it records where the hours actually go and compares them with what you planned. A typical setup takes these steps:
-
Build the work structure.
Create customers, projects and tasks to mirror your WBS. Time is always tracked at the task level, so the task list is your activity list.
-
Set estimates, deadlines and assignments.
Add estimated hours and a deadline to each task, set priority and workflow statuses, and assign tasks to the people who will do them.
-
Track time where people work.
Team members log hours in a weekly timesheet, in a calendar view with start and stop times, in the mobile app, or with the Chrome extension timer.
-
Watch the variance.
The Estimated vs. Actual Time Report shows the gap per task, and a time budget on a task, project or customer turns its progress bar red when it is exceeded.
-
Close the loop.
Use the Time-Track Report after each project to see where time went by project, task, user or type of work, and feed those actuals into your next estimates.
If timesheets need sign off before the numbers count, Time-Track Approval lets managers review and approve them, and the Kanban view shows task progress by status. You can test all of this in the free trial, which runs for 30 days and includes every feature.
FAQ
What are the six processes of project time management?
In the PMBOK Guide Sixth Edition, the processes are plan schedule management, define activities, sequence activities, estimate activity durations, develop schedule, and control schedule. The first five build the schedule and the sixth keeps it on track during the project.
Is project time management the same as project schedule management?
Yes, in practice. PMI renamed the knowledge area from Project Time Management to Project Schedule Management in the PMBOK Guide Sixth Edition (2017) to put the focus on the schedule as the thing being managed. The Eighth Edition (2025) calls the same area the Schedule performance domain.
What are the stages of project management?
Models differ, so you will see four, five or six stages depending on the source. PMI’s five groups are initiating, planning, executing, monitoring and controlling, and closing. Project time management sits mainly in planning (building the schedule) and in monitoring and controlling (keeping it on track).
How do you calculate schedule variance?
Subtract planned value from earned value: SV = EV − PV. A negative result means you are behind schedule. The schedule performance index, SPI = EV / PV, expresses the same thing as a ratio, where anything below 1.0 is behind.
What is the critical path in project time management?
It is the longest sequence of dependent activities from start to finish. Its total duration is the shortest time in which the project can be completed, so a delay on any critical activity delays the whole project unless you recover the time elsewhere on that path.
What time management techniques help project managers personally?
The project processes above manage the team’s time; for your own day, techniques such as time blocking and the Covey time management matrix help you protect time for planning and risk review instead of spending the whole week in reactive work.
Can you manage project time in a spreadsheet?
For a small project with a handful of tasks, yes. Spreadsheets become hard to keep accurate once several people update them, when you need actual hours per task, or when you want to compare estimates with actuals across projects. That is the point where a time tracker or project tool pays off.
What tools are used for project time management?
Most teams combine a scheduling tool (Gantt chart or timeline) for the plan with a time tracking tool for the actuals. The scheduling tool tells you when work should happen; the time tracker tells you how long it really took, which is what schedule control and future estimates depend on.
Keep your schedule tied to real hours
A schedule is only as reliable as the estimates behind it and the progress data used to check it. Build it with the six processes, then compare it with actual hours every week so slips show up while you can still act.
Start a free 30-day trial of actiTIME, or book a demo if you want a walkthrough.