Are you feeling overwhelmed by all the moving parts of planning a project? Are coordinating your team’s operations making you want to pull your hair out? If so, then rest easy knowing that a Gantt chart can help alleviate much of the stress.
Essentially, it organizes and visualizes your workflow from beginning to end – providing an at-a-glance look into how projects are progressing and what needs to be done next (plus lots more).
In this guide, we’ll go over everything you need to know about using Gantt charts for successful project management. We’ll cover what they look like and why they’re so useful. Plus, we’ll explore some of the best available Gantt chart software on the market.
So, if you’re ready to step up your project management game, read on.
What Is a Gantt Chart?
A Gantt chart is a project visualization tool that helps you plan, schedule, and track tasks over time. It was developed by Henry Gantt in the early 1900s as a way to improve efficiency and productivity in the workplace through smart estimation of time and other resources.
Gantt charts consist of a horizontal timeline that represents the project’s duration and tasks listed vertically on the timeline. Each task is depicted as a bar, with the length of the bar representing the duration of the task. This makes it easy to track progress and identify any potential issues that may arise during the project.
Gantt Chart Elements
- Task name to discern one piece of work from the other.
- Start date is represented by the beginning of the taskbar in the chart.
- End date is represented by the end of the taskbar in the chart.
- Duration, i.e., the time period between the start and end dates of a task, which can be measured in hours, days, weeks, or months.
- Task completion %, which is often represented by a shaded portion of the taskbar.
- Dependencies, i.e., the relationships between tasks, where the completion of one task is dependent on the completion of another. There are four types of dependencies: finish-to-start, start-to-start, finish-to-finish, and start-to-finish.
- Milestones, i.e., significant events or achievements in the project, such as the completion of a phase or the delivery of a major deliverable. They are represented by a diamond-shaped symbol (or any other symbol of choice) in the chart.
- Critical path, i.e., the sequence of high-priority tasks that must be completed on schedule. It is often shown in red on the chart.
- Resources, i.e., the people or equipment assigned to work on tasks.
- Baseline, i.e., the original plan or schedule for the project, against which actual progress is measured. It is often shown as a dotted line in the chart.
How Do Gantt Charts Help?
- Project visualization: A Gantt chart provides a visual representation of your project timeline, making it easier to understand the overall project duration, work scope, and deadlines. This simplifies team coordination and allows you to clearly see if the scheduled tasks are completed as planned.
- Resource allocation: You can assign deadlines and various resources to different tasks within the project timeline, balancing team workloads and managing potential conflicts. This allows you to optimize resource utilization and minimize the probability of project overruns.
- Risk management: With a proper Gantt chart, you can identify potential project risks, such as delays, resource constraints, and missed deadlines. This allows you to take corrective actions to mitigate the risks before they go out of hand. You can also track your project’s progress and analyze trends to optimize your strategy and improve performance.
Most Common Gantt Chart Use Cases
1. Project manager
As an expert responsible for overseeing a project from start to finish, project managers use Gantt charts to plan the timeline, break down tasks into smaller components, and track the progress of each team member. By comparing actual work results to the Gantt chart, they can identify any issues early on and make necessary changes to ensure the project stays on track.
2. Project sponsor
Project sponsors give approval for projects and have a keen financial interest in keeping them on the right track. They use Gantt charts to assess the feasibility of the project, determine the resources required, and monitor team performance to ensure each project is successfully meeting all the set objectives.
3. Project team
The project team is responsible for executing tasks assigned by the project manager. They use the Gantt chart to understand what is expected of them, track their own progress, and communicate with the manager about any issues that arise.
4. Business owner
A business owner is an important stakeholder who evaluates projects for potential value and manages resources for their business. They use Gantt charts to evaluate project timelines, assess resource requirements, and plan for future business endeavors. This helps them to make informed decisions about how to allocate resources in the best possible way and prioritize projects depending on their outcomes and investments required.
How to Create a Gantt Chart: 10 Best Practices
Step 1: Define project scope and objectives
You need to have a clear understanding of what your project entails before you start documenting it. Start by determining the purpose and goal of the project – what is it meant to accomplish? After that, identify what exactly should be done to achieve the set goal – how will it be accomplished?
Step 2: Identify milestones
Milestones are significant points in the timeline of a project that provide clear markers of progress toward larger objectives and the final goal. These milestones could be something like completing specific tasks, delivering key documents or reports, or achieving certain targets within the set timeframe.
Step 3: Estimate task duration
When it comes to task estimation, there are many methods to consider, but historical data is always a great place to start. By looking at how long similar tasks have taken in the past, you can get a good idea of what to expect.
Besides, you can gather input from your employees – they are the ones who will be doing the work, after all. By asking for their insights and opinions, you can gain a better understanding of how long certain tasks may take.
Step 4: Sequence tasks
Task sequencing is the process of determining the order in which tasks need to be completed to ensure that the project stays on track and is delivered on time. It can be done using a variety of approaches, including the Critical Path Method (CPM) and the Program Evaluation Review Technique (PERT).
These methods help to prioritize tasks, identify dependencies between them, calculate the critical path (the longest path of tasks that must be completed in a certain order), and ultimately visualize your entire project’s timeline.
Step 5: Assign resources
First off, it’s important to identify exactly what resources are needed for each task. This could include anything from equipment and materials to personnel and time.
Then, proceed to assess resource availability and prioritize accordingly. Can the resources needed for a particular task be acquired easily and quickly? Or are they in high demand and require more time and effort to obtain? This information will help you determine which tasks should take precedence over others.
Next, consider the capabilities and expertise of available personnel. Are certain team members better suited for specific tasks based on their skill sets and experience? Make sure to assign tasks to those who can complete them competently and efficiently.
Step 6: Set deadlines
Rather than simply picking a date out of thin air, take the time to analyze your task estimates and resource availability. Only then, you may start to define deadlines.
In general, it’s best to establish deadlines that are a bit earlier than the actual due date. This provides a buffer in case any unexpected issues arise, and also allows for time to review and make any necessary adjustments before the final deadline.
Step 7: Monitor progress
Using the Gantt chart, it’s easy to track progress against the planned timeline. You can do this by shading in the bars for completed tasks or using different colors to indicate progress. This allows you to see if you’re on track or if you need to take action to get back on schedule.
Step 8: Update regularly
Your Gantt Chart should be a living document that changes as the project progresses. Make sure to update it regularly to reflect any changes or delays. This will help us stay on top of any issues and make quick adjustments as needed.
Step 9: Keep it simple
Remember, the whole point of a Gantt chart is to give a quick and easy-to-read overview of the project timeline. If you make it too cluttered, you’ll defeat the purpose and end up with a confused team.
So, instead of trying to depict every detail, focus on major milestones and key deadlines. This means your chart will be less cluttered and will better communicate what should be done and when.
Step 10: Use the right software
Gantt chart software is designed to make project planning and management much easier and efficient. On top of that, modern Gantt chart tools often comes with a range of additional features, such as task prioritization, resource allocation, budget tracking, and team collaboration. These features enable project managers to stay on top of every aspect of their project and make informed decisions throughout the project lifecycle.
8 Best of the Best Gantt Chart Software Tools
1. FigJam
- Interactive whiteboard
- Flexible Setup
- Intuitive diagramming
- Templates for any need
FigJam is one of the latest collaboration tools offered by Figma, and it’s specifically designed for brainstorming and ideation. With FigJam, users can create and organize sticky notes, draw shapes and lines, add images, and collaborate with others in real time.
When it comes to Gantt charts specifically, FigJam provides a really intuitive drag-and-drop interface that makes it easy to plan out timelines and manage tasks. Plus, there are tons of helpful templates and widgets that make the brainstorming process even more streamlined.
Why choose FigJam?
The platform’s drag-and-drop functionality, customizable templates, and easy-to-use tools make brainstorming and visual thinking a breeze.
Weaknesses
While FigJam is great for brainstorming and ideation, it has a limited set of features compared to other similar tools. If you’re looking for more advanced features like project management and task tracking, you may need to look elsewhere.
Pricing
The Starter plan, which is suitable for solo users and small teams, is forever free.
FigJam Professional will cost you $3 per editor a month (if paid annually).
FigJam Organization and Enterprise cost $5 per editor a month (paid annually).
2. TeamGantt
- Project plan templates
- Team availability
- Project health reports
- Calendar and list views
TeamGantt is a powerful project management tool that allows teams to collaborate, plan, and execute projects in a seamless manner. Gantt chart building is one of its key features, but on top of that, the tool allows you to see team availability across all projects so you can plan and assign tasks accordingly. This feature saves you countless hours of back-and-forth emails and phone calls trying to figure out who can take on the next task.
TeamGantt also generates project health reports, giving you a quick and easy overview of how your project is progressing. No need to spend hours poring over spreadsheets and data to see if any task is falling behind – TeamGantt does the heavy lifting for you.
Why choose TeamGantt?
This online platform offers a wide range of features – including file sharing and time tracking – that can help teams plan, track, and manage their projects more efficiently.
Weaknesses
TeamGantt has limited reporting features, which makes it difficult to get a comprehensive overview of projects. Besides, it lacks functionality for cost and budget tracking.
Pricing
The Pro plan with limited functionality costs $49-59 per manager a month.
The Unlimited Everything plan costs $799 a month (paid annually).
3. GanttPRO
- Workload management
- Time logs
- Reports
- Collaboration
GanttPRO enables you to create detailed Gantt charts that showcase task dependencies, timelines, and project progress. It also allows you to track resources, manage budgets, and set deadlines to ensure timely delivery.
One of the unique features of GanttPRO is the ability to collaborate in real time with your team members and share updates instantly. You can add comments, attach files, and assign tasks to team members conveniently. Besides, with GanttPRO, you can generate custom reports on project progress, task completion, and resource allocation. They help to identify potential roadblocks, track progress toward completion, and ensure that your projects stay on track.
Why Choose GanttPRO?
The software has a mobile app that enables you to access your projects from anywhere and stay connected with your team. This feature is especially helpful if you have remote team members or need to work on projects while on the move.
Weaknesses
One possible drawback of GanttPRO is that it can be a bit overwhelming for beginners. If you’re new to project management software, you might find the interface confusing or difficult to navigate.
Pricing
The prices start from $7.99 per user a month.
4. Instagantt
- Critical path
- Kanban board
- Time off management
- Public snapshots
Instagantt is a simple project management tool designed to wean you off the dependency of complicated spreadsheets. It provides you with the flexibility of customizing your project timelines, making changes in real time, and keeping track of work in a Gantt chart format.
Also, Instagantt features a Kanban board that lets you visualize your workflow and move your tasks across different stages. And the built-in time off management system makes it easy to keep track of your team’s absences and ensure that your project stays on track.
Why choose Instagantt?
Instagantt has a user-friendly interface that allows you to create and manage tasks with ease.
Weaknesses
While Instagantt is great for basic project management, it lacks some of the more advanced features that other platforms offer. For example, it doesn’t have the built-in time logs that TeamGantt and GanttPRO include.
Pricing
The Individual plan costs either $7 a month or $70 a year.
The Team plan costs either $5 a month or $50 a year.
5. Tom’s Planner
- Progress tracking
- Simple interface
- Templates
Tom’s Planner is a user-friendly and intuitive online scheduling tool that helps teams stay organized and on top of their projects. You can also assign tasks to team members, set deadlines, and track progress in real time. The best part is that everything is customizable, so you can tweak the tool to fit your specific needs and workflow.
The tool’s drag-and-drop interface makes building your schedule a breeze. Its intuitive design means you can quickly create Gantt charts, timelines, and other visual representations of your project’s progress. Plus, you can easily customize colors and labels to match your brand or personal preferences.
Why choose Tom’s Planner?
Unlike complicated project management software, Tom’s Planner is easy to use and doesn’t require any special training.
Weaknesses
One major downside is the tool’s limited functionality for project management. While it excels at scheduling, it falls short in providing the necessary features for team collaboration, reporting, and more.
Pricing
Tom’s Planner Personal with limited functionality is free to use.
The price for the paid versions of the tool start from $9.95 a month.
6. Backlog
- Task boards
- Document management
- Burndown charts
Backlog is a comprehensive project management tool that lets you manage your entire workflow from start to finish. On top of Gantt charts, it features a powerful Kanban-style board, which lets you visualize your workflow and move tasks from one stage to the next with ease. You can customize your board to fit your team’s unique needs, and even set up automatic notifications for when tasks are moved or completed.
But Backlog is much more than that. It also includes features like issue tracking, project planning, and collaboration tools that make it easy to get all your team members on the same page.
Why choose Backlog?
One of the biggest benefits of Backlog is its versatility. It can be used for a wide variety of projects, from software development to marketing campaigns to event planning.
Weaknesses
While Backlog does offer a free plan, it’s fairly limited in terms of functionality and the number of users it can accommodate. To unlock more advanced features and support larger teams, you’ll need to upgrade to a paid plan, which can get pricey.
Pricing
There is a free version for up to 10 users.
The Starter plan for up to 30 users costs $35 a month.
The Standard plan for unlimited users costs $100 a month, and the Premium plan – $175 a month.
7. Agantty
- Task overview
- Task allocation
- Notifications
Agantty is a project management tool designed with a thought-through Gantt chart feature as its focal point. This means that you can keep track of all your tasks in one place and see how they relate to each other in terms of timelines and dependencies.
With Agantty, you can easily manage an unlimited number of teams and projects. You can assign tasks to specific employees, set deadlines, and see how everything is progressing in real time. And if something changes, you can easily adjust the Gantt chart to reflect the new timeline.
Why choose Agantty?
One of the biggest advantages of Agantty is its visual appeal. The layout is clean and well-organized, making it easy to navigate around the platform.
Weaknesses
Agantty lacks advanced reporting features. While you can generate basic reports on your projects and team members, you may find that the reporting capabilities are somewhat limited.
Pricing
There is a free version that lets you manage just one project at a time.
Agantty Premium costs €4,90 per user a month or €50 per user a year.
8. Redbooth
- Productivity reports
- Kanban board
- Project dashboards
- Video meetings
Redbooth is a cloud-based collaboration and project management software designed to cater to the needs of modern-day businesses. It offers a plethora of features such as task lists, Gantt charts, team chat, file sharing, and time tracking, all in one place, to ensure seamless team communication and collaboration.
With Redbooth, teams can easily assign and track tasks, set deadlines, and monitor progress in real-time. It also allows users to share files with their team, make comments, and provide feedback, making collaboration smooth and hassle-free.
Why choose Redbooth?
Redbooth offers a variety of useful features for team collaboration and video conferencing is probably the strongest of them all. Besides, Redbooth can be integrated with a multitude of other tools – such as Google Drive, Trello, and Dropbox – which helps to streamline collaboration even more.
Weaknesses
A potential drawback is the learning curve involved in getting started with Redbooth. While it’s not overly complicated, there are a lot of features to learn and it may take some time for new users to get up to speed.
Pricing
Redbooth Pro costs $9 per user a month (if billed annually), and Redbooth Business costs $15 per user a month.
Gantt Chart Disadvantages
- Gantt charts can quickly become overwhelming and unwieldy: When you have a lot of tasks and subtasks to keep track of, it’s easy for the chart to get cluttered and difficult to read. This can make it challenging to discern what’s going on in the project at a glance, which defeats the purpose of using a visual aid in the first place.
- Gantt charts may create a false sense of certainty around project timelines: Since they provide a clear start and end date for each task, one may fall into the fallacy of assuming that everything will go according to plan. However, we all know that real-world projects rarely progress without a hitch. Unforeseen delays, resource constraints, and other variables can throw the entire chart out of whack, leaving teams scrambling to catch up.
- Gantt charts can be overly complex for smaller projects: While project management software has made the process of creating Gantt charts much easier, it still requires a significant investment of time and effort to get everything set up correctly. So, if you’re managing a team of just a few people and don’t have a ton of tasks to keep track of, a simple task list or Kanban Board might be a more practical choice.
- Gantt charts don’t work that well with agile project management methodologies: Agile projects are all about adapting quickly to changing circumstances, and Gantt charts simply aren’t agile enough to keep up. Their linear nature doesn’t easily allow for things like quickly reordering tasks or adding in new ones on the fly.
An Excellent Alternative to Gantt Chart Software
actiTIME is one splendid alternative to Gantt chart software, offering a range of powerful project management features, intuitive visualization tools, and real-time reporting capabilities. Whether you’re managing a small team or a large-scale project, it is sure to help you stay organized, efficient, and focused on achieving your goals.
One of the most significant advantages of using actiTIME instead of Gantt chart software is that it helps not just to plan out your project timeline but to stay on top of all the aspects of your team’s work. With its assistance, you can:
- Think through your entire work scope,
- Allocate tasks to team members,
- Set work deadlines,
- Track time and costs put into projects,
- Generate detailed performance reports and more.
This means you can streamline your entire project management process while improving your team’s efficiency and productivity.
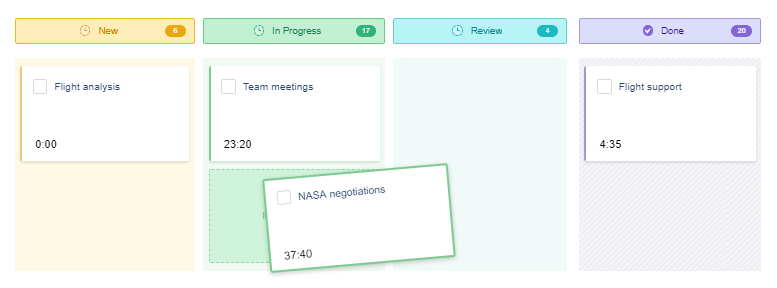
actiTIME features the Kanban board, which is a great option for agile teams that want to focus on continuous improvement and prioritizing tasks. It allows you to visualize the status of work in progress, set priorities, and monitor performance in real time.
This feature is particularly useful for teams that work on multiple projects simultaneously and need to carefully manage their workloads while juggling myriads of tasks at once.
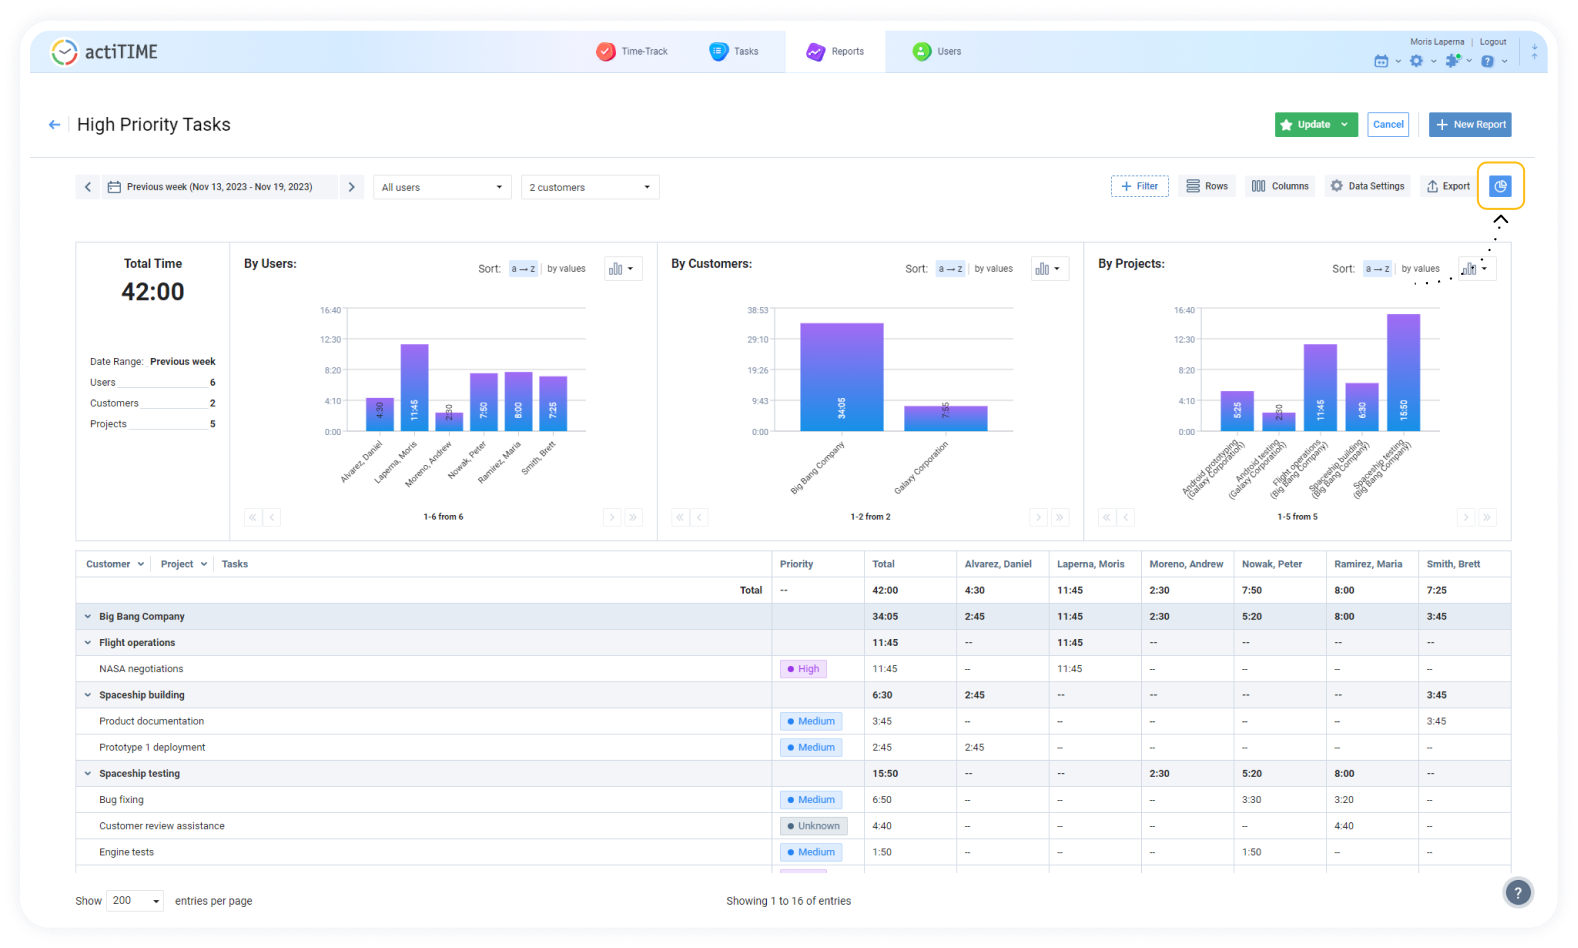
On top of that, actiTIME offers a range of other options for project visualization, including charts with data on team performance, real-time reporting widgets, and an estimate tracker. These tools enable you to stay on top of your projects and make informed decisions based on accurate and in-depth insights.
All in all, if you’re looking for an all-in-one solution that combines time tracking, project management, and resource allocation, actiTIME could be the perfect alternative to traditional Gantt chart software. So, give it a try for free!